Reports
Reports based on data gathered for March 2020.


The ILDFT project came about because Mr Paul Nulty suggested we revive it. We stood there and laughed at him and said it would never happen. We cannot work out why or how, but we did revive it and fools that we are, figured we needed to create an international version this time. In 2011, we included 82 designers across 47 companies. In 2014, we expanded to include 253 designers from 142 companies in the UK. This time, we asked designers around the world to provide their data to help us get it right, sharing with us all the companies that they have worked with in their lighting design career. Almost 900 of you did!
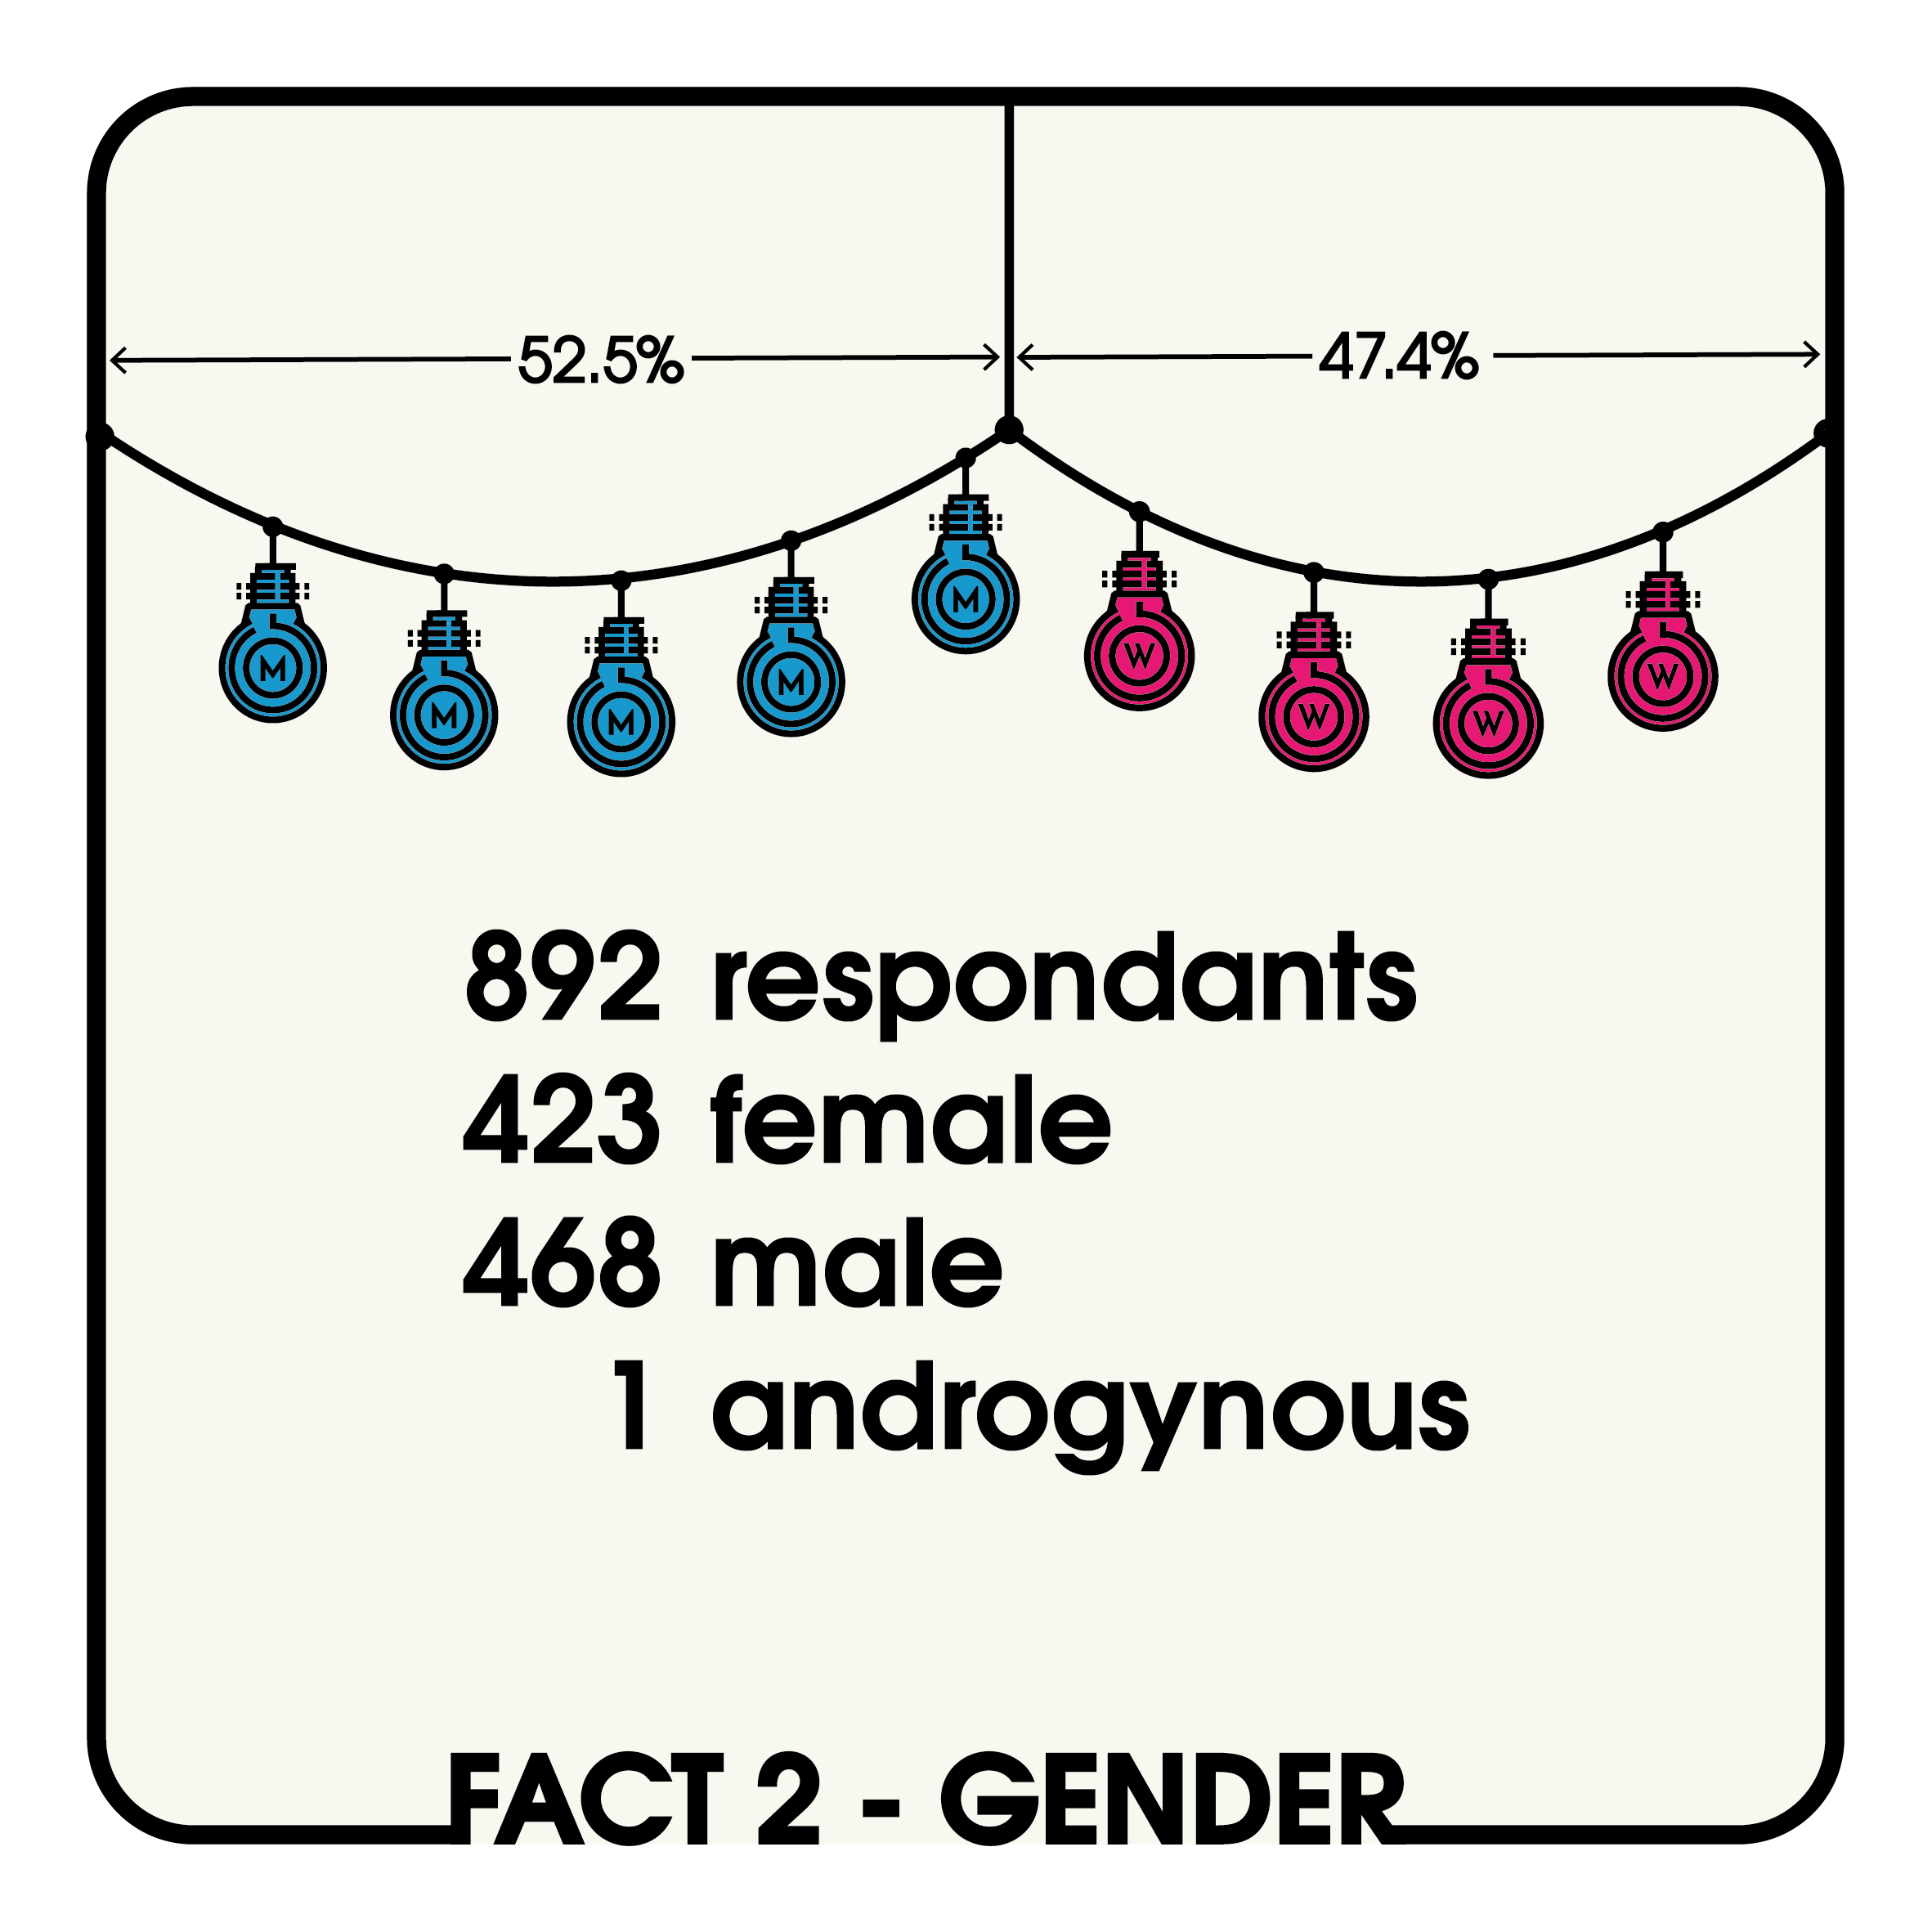
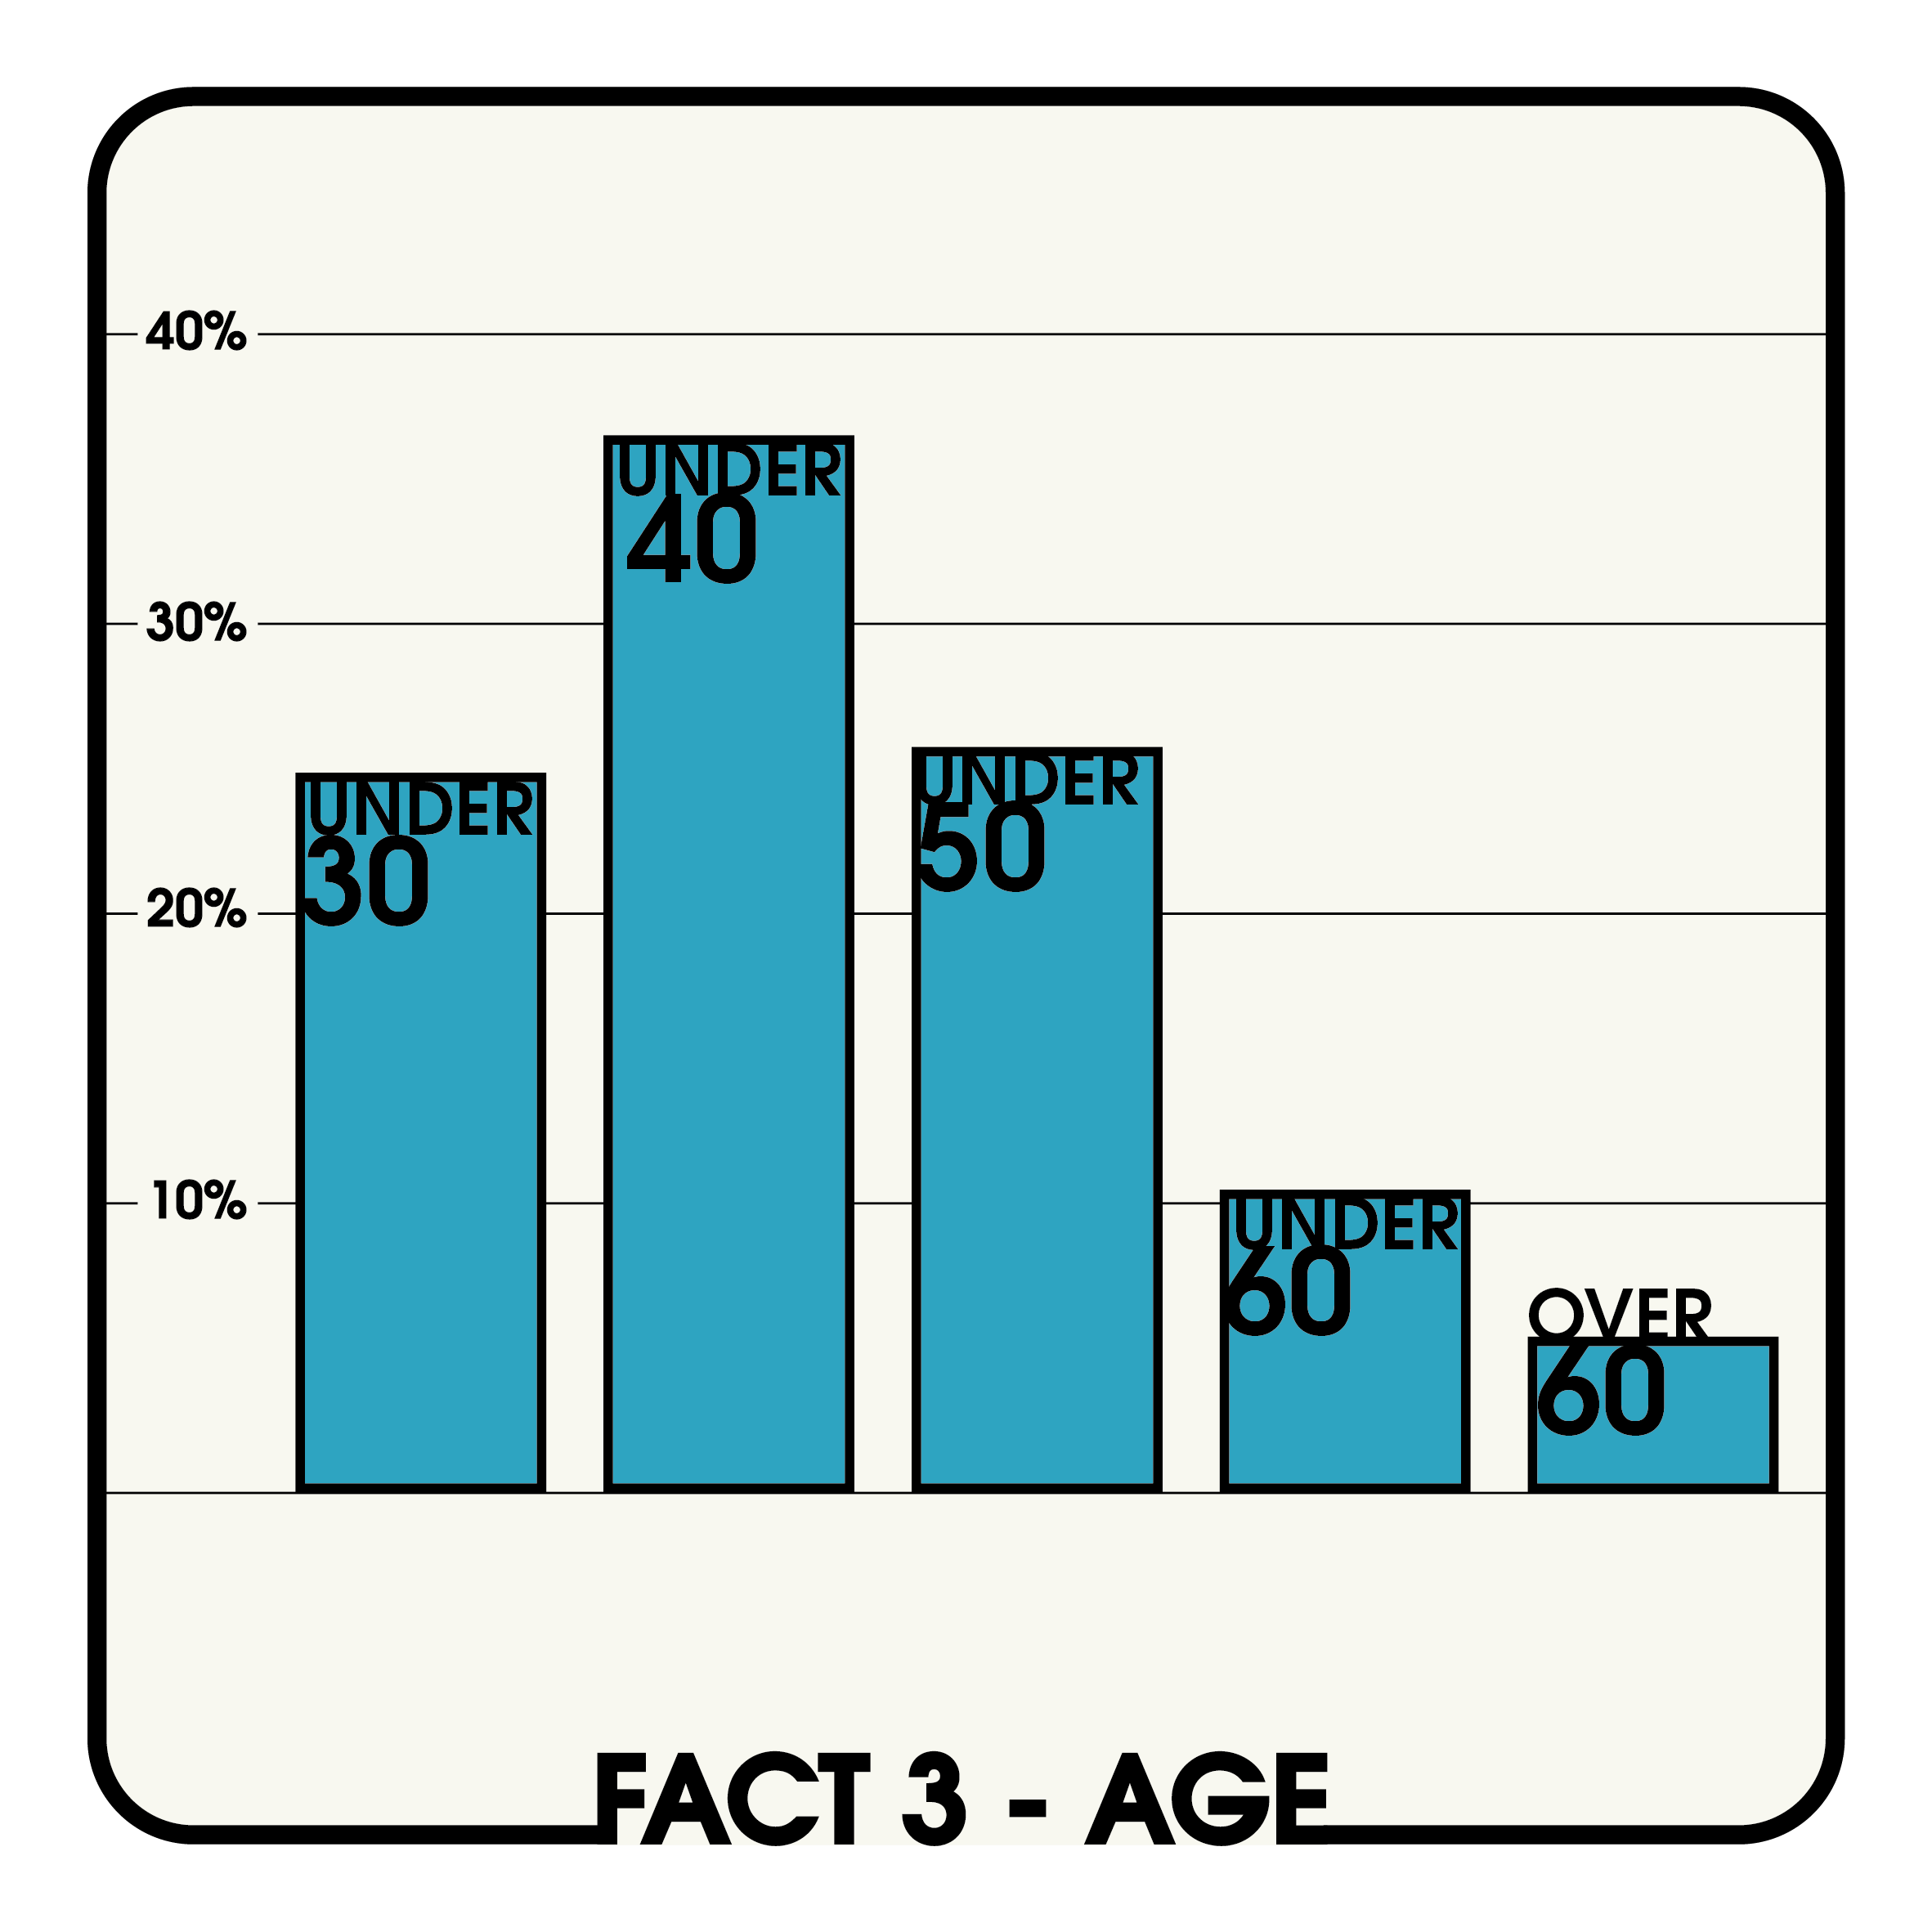
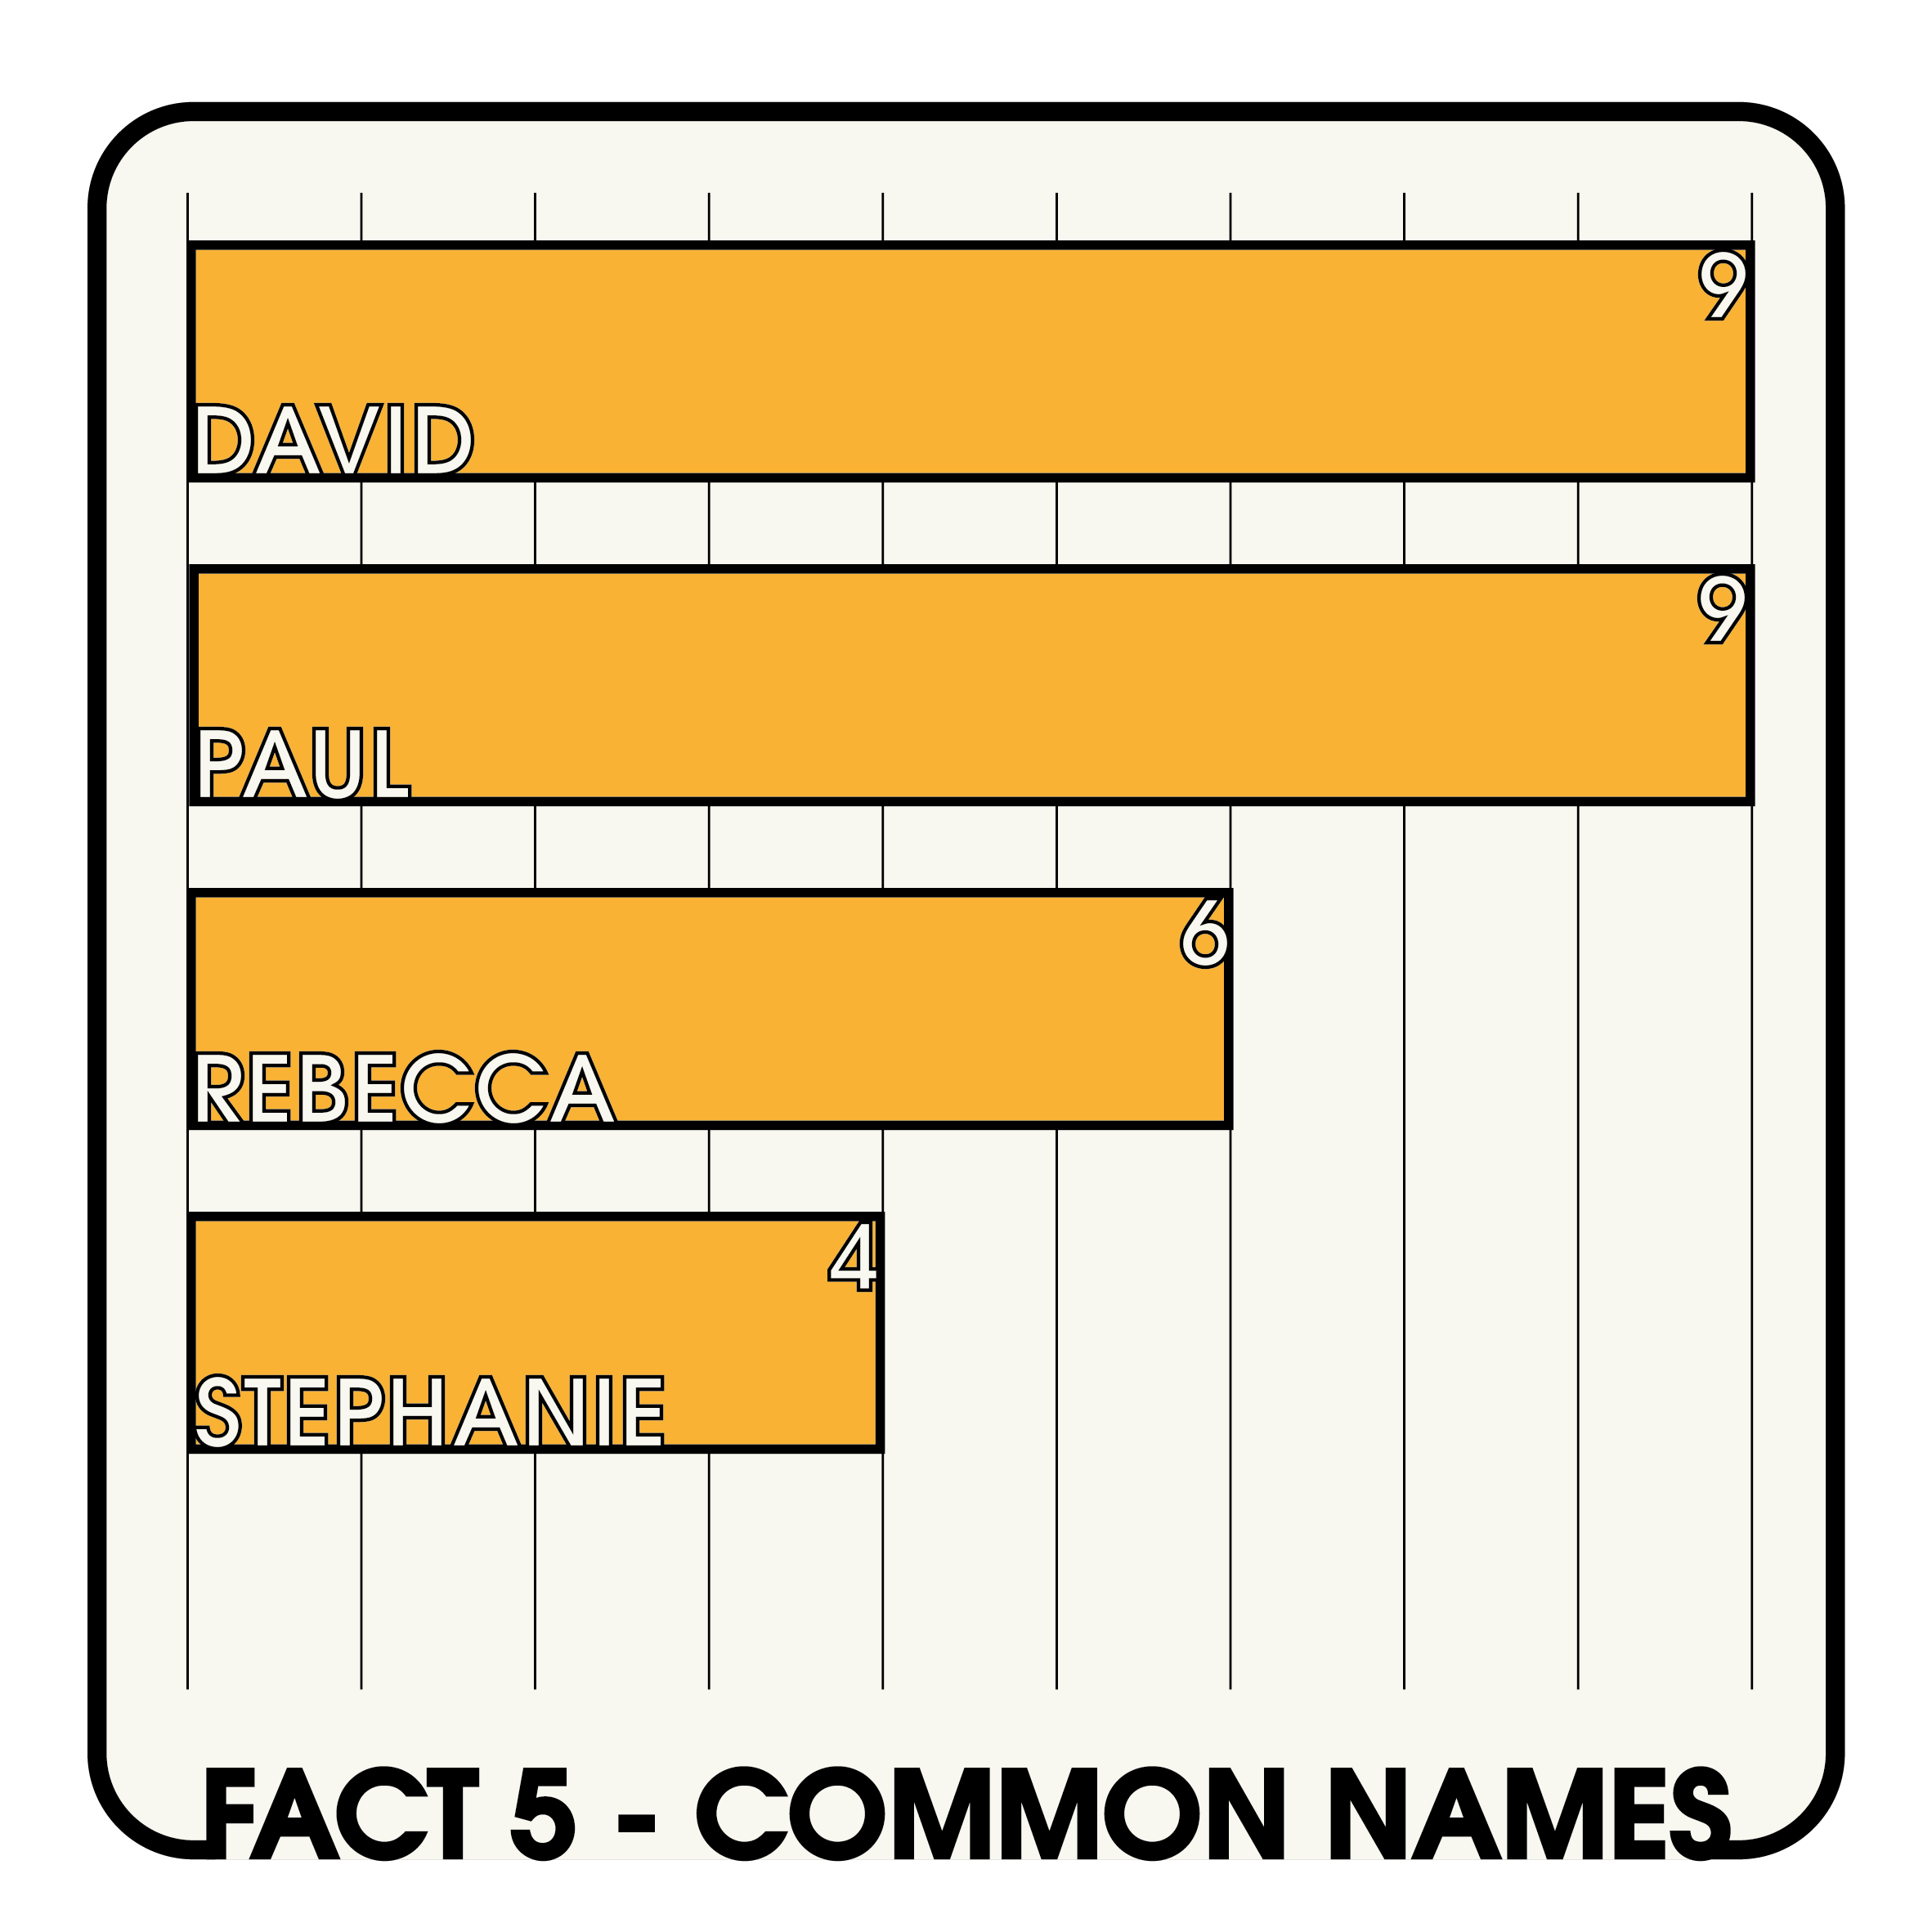
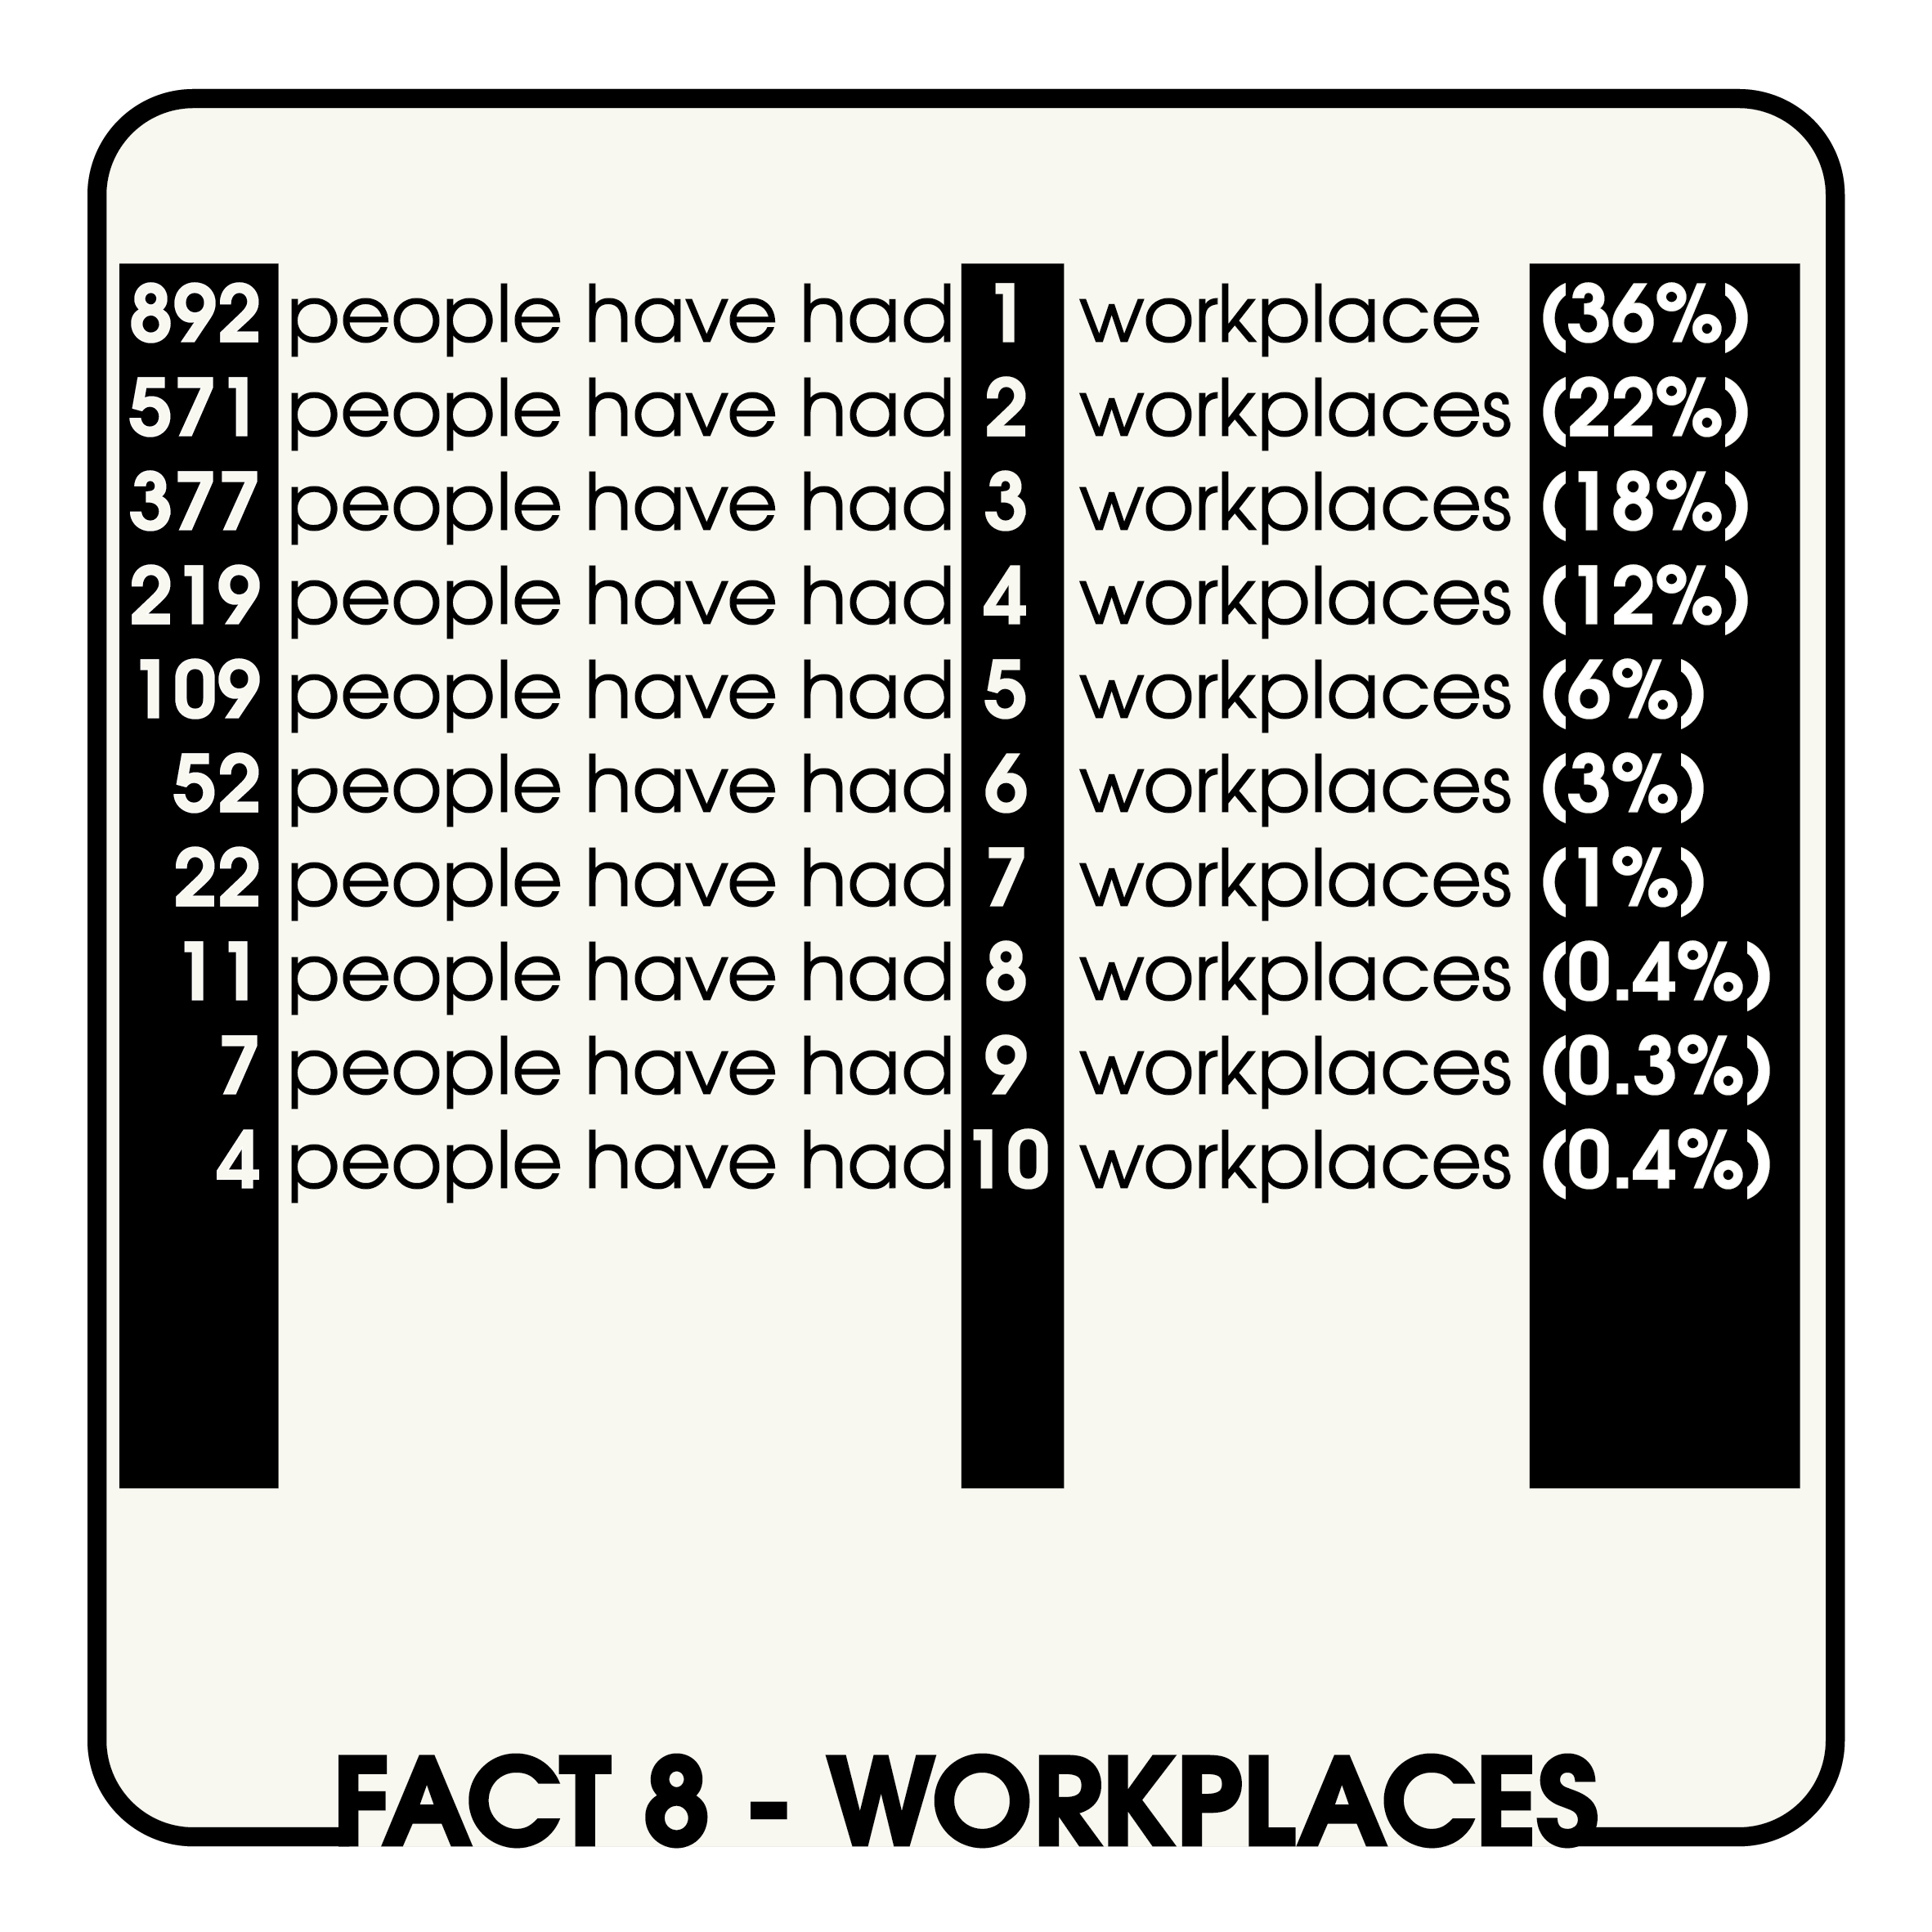
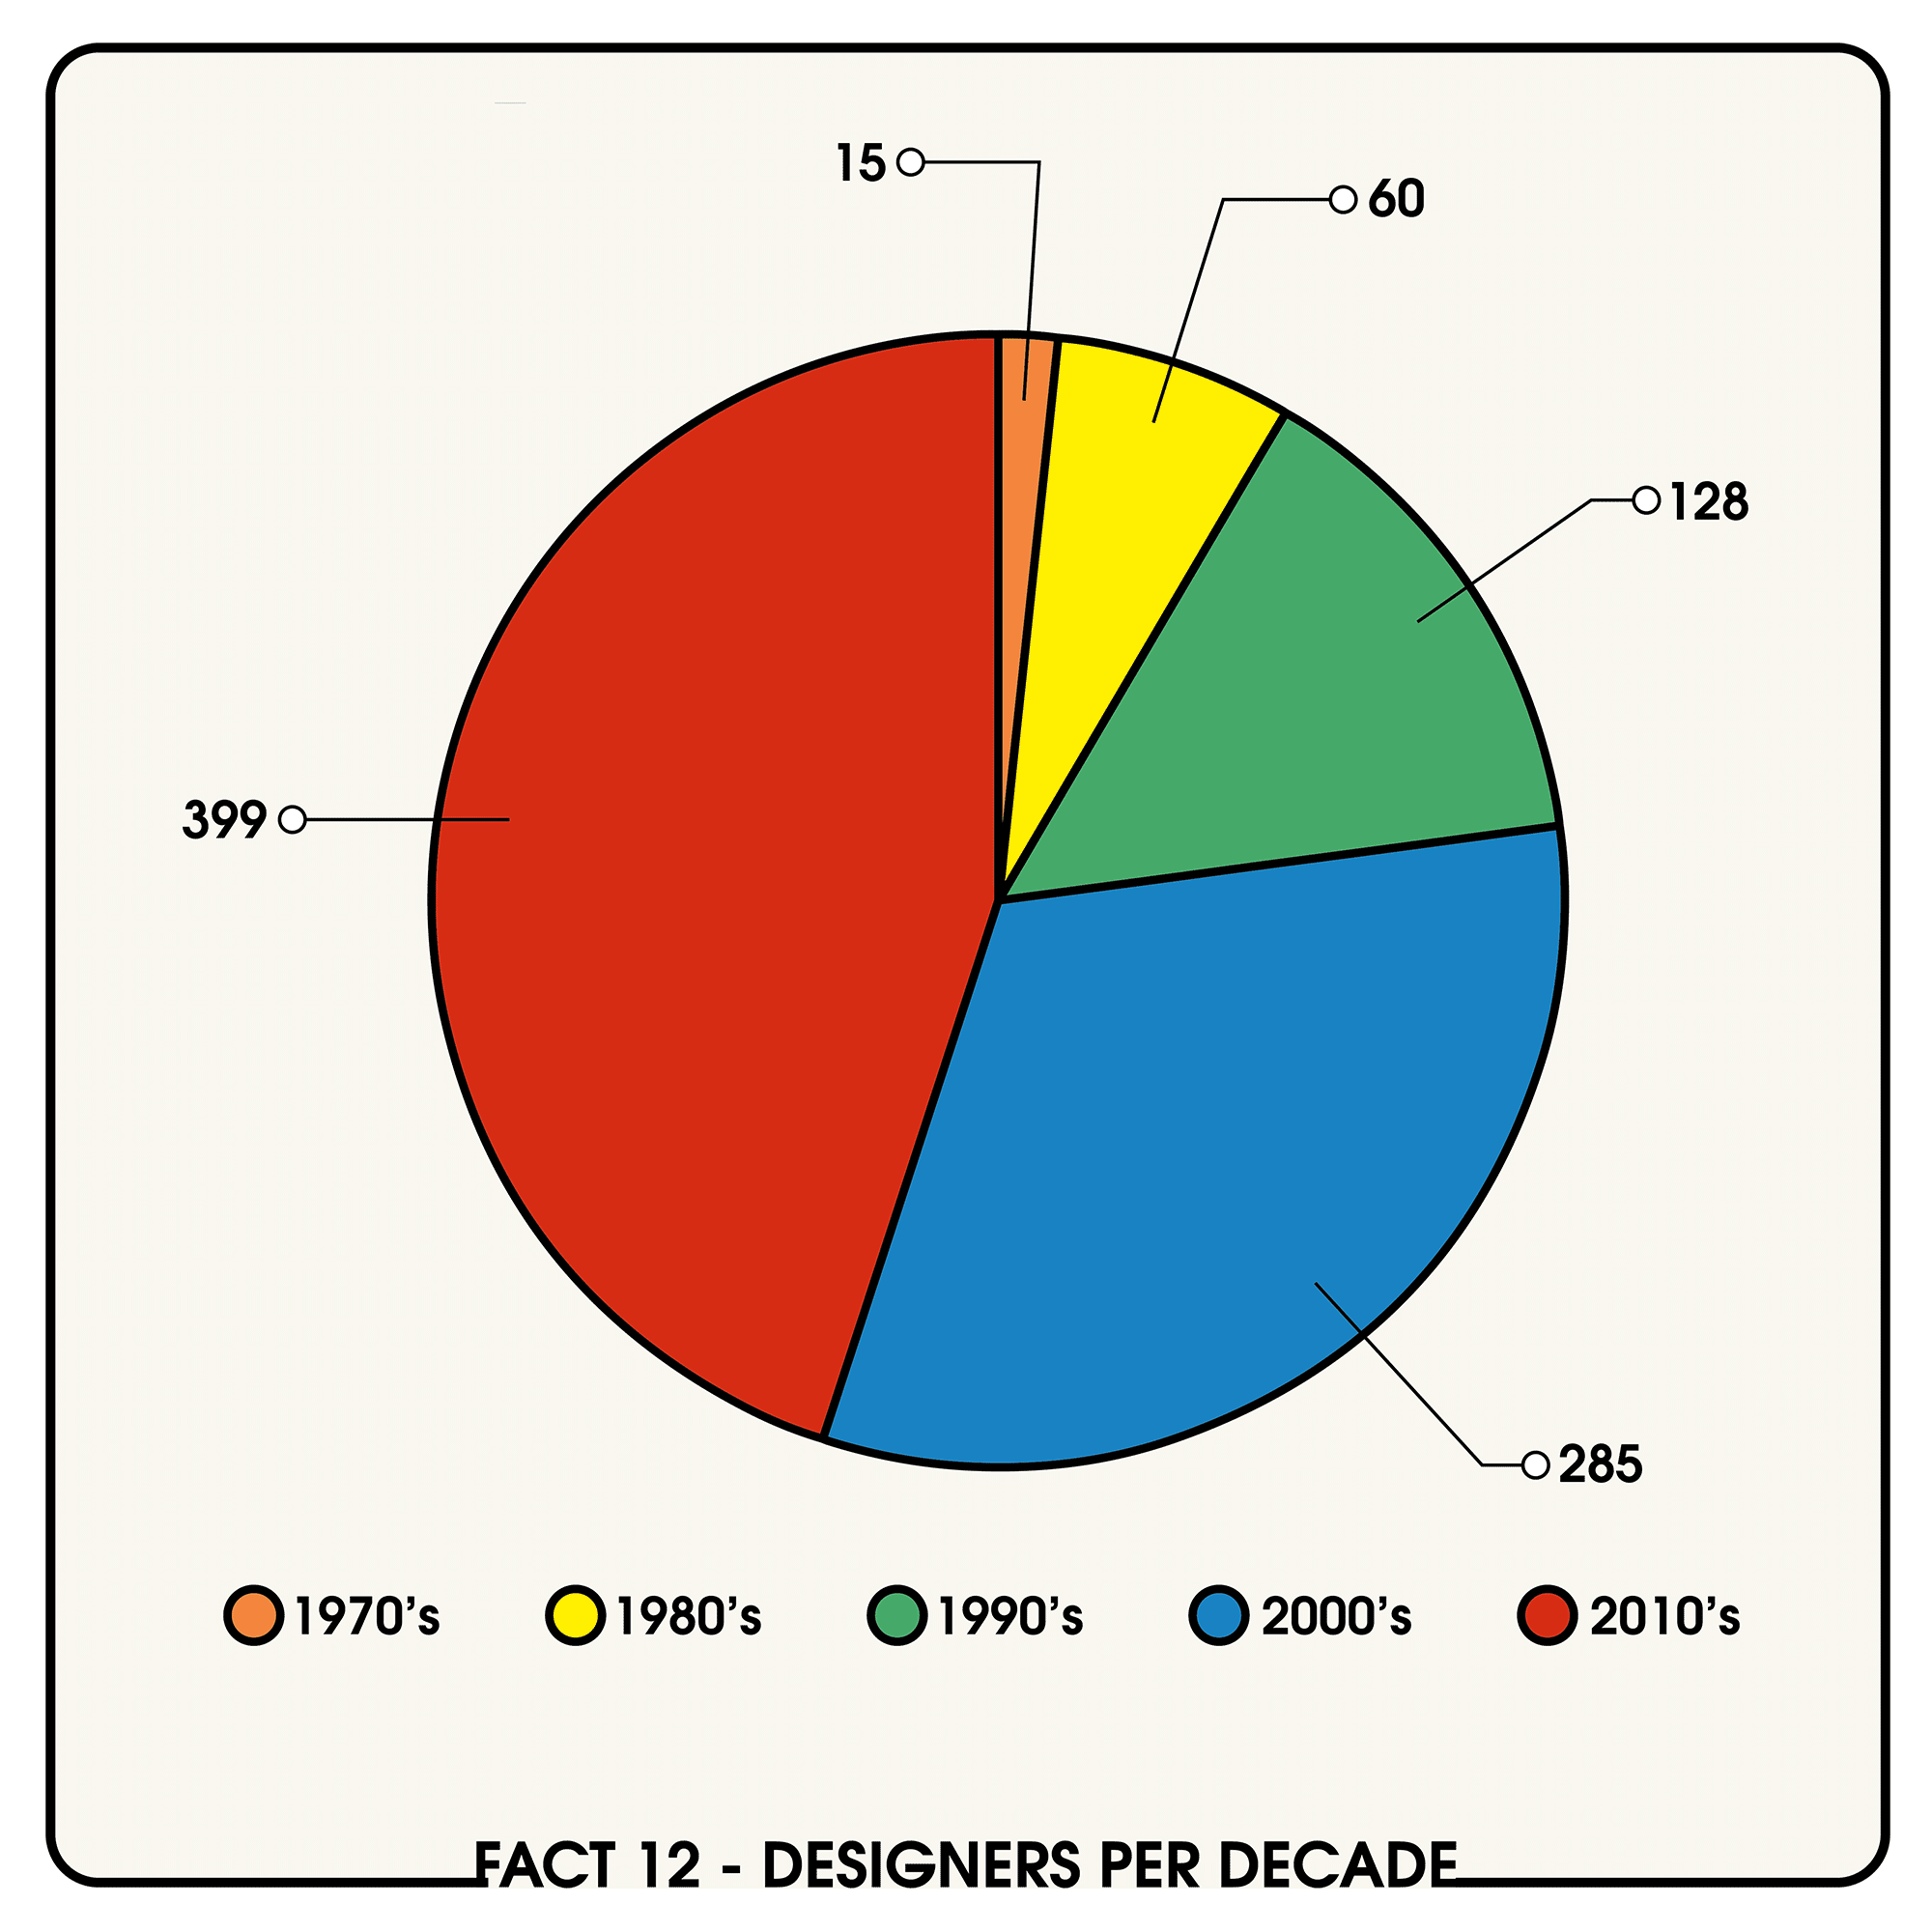
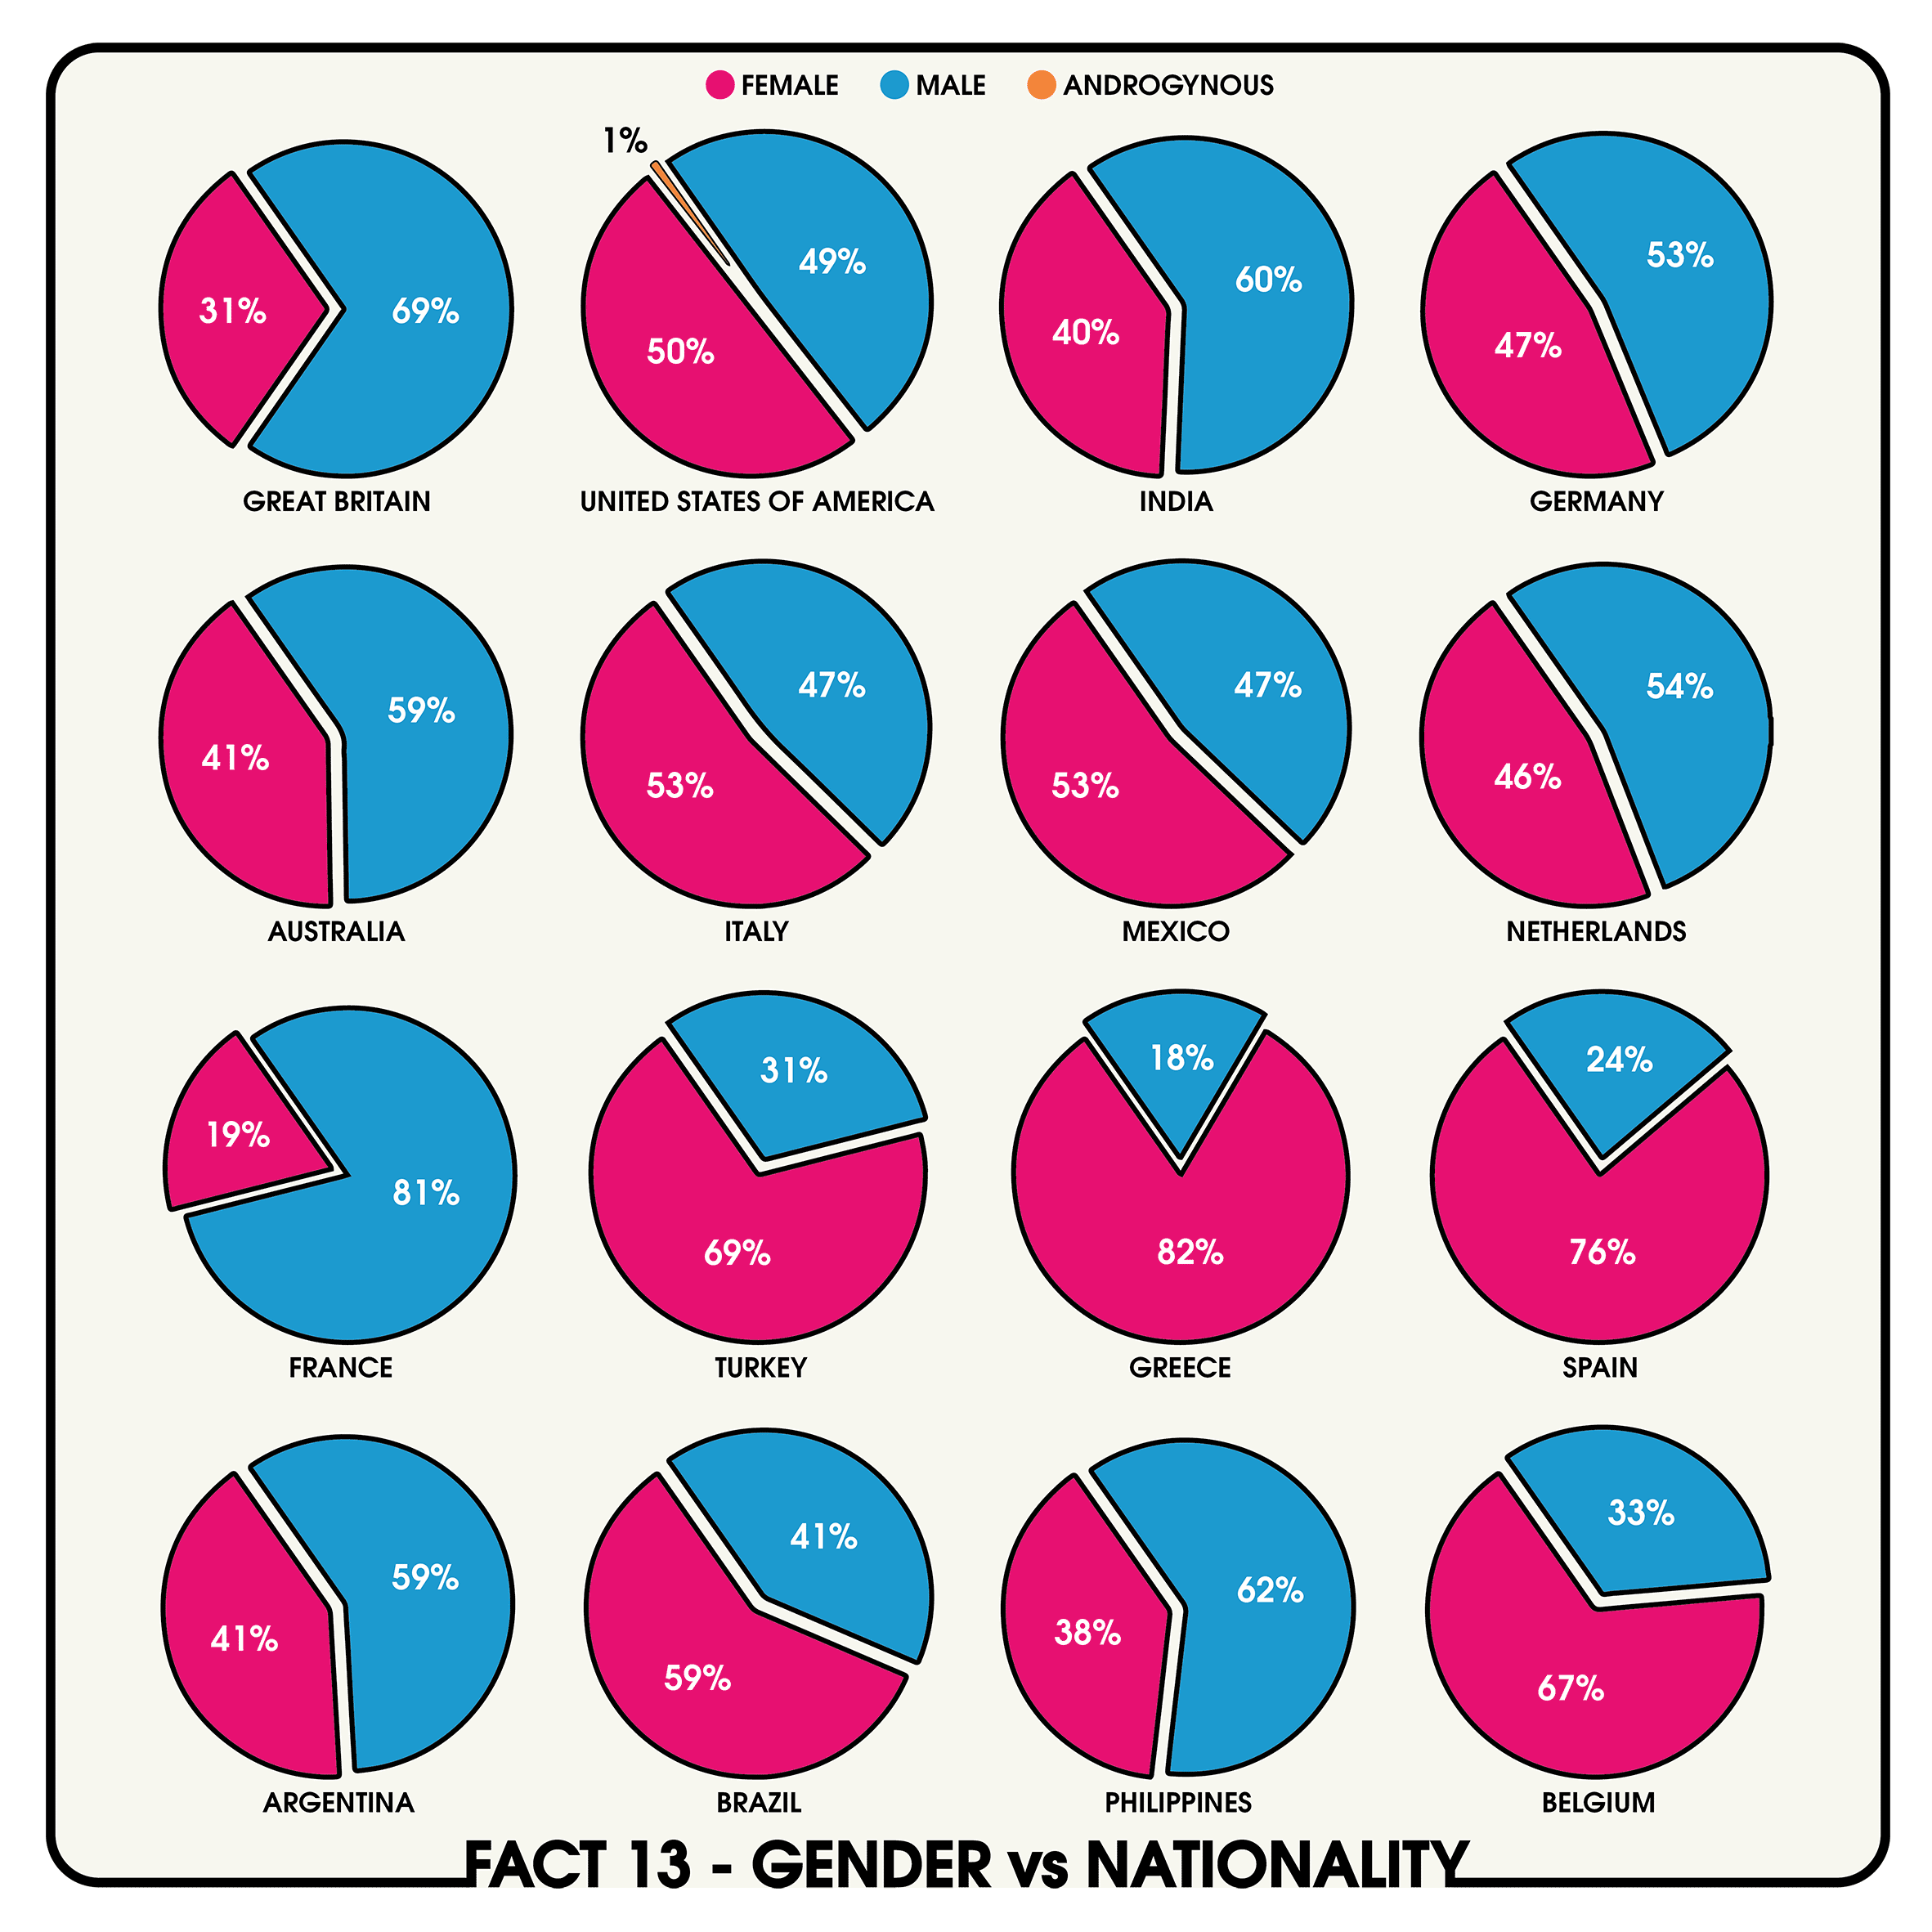
Analysis of the data allowed us to see which countries designers come from, when their career has taken them overseas, what the most popular background is for a designer, the gender split, the age split, popular names for designers or companies and other facts like how many companies people have worked for. You may remember seeing something about it at the start of 2020 and you may have even submitted your data. Then the world changed forever and it would have slipped your mind. We filed it away as something that wasn’t going to happen and got on with the serious stuff. In the last few weeks, it occurred to us that as nearly 900 people shared their information with us, it was unfair to never realise it in some way.
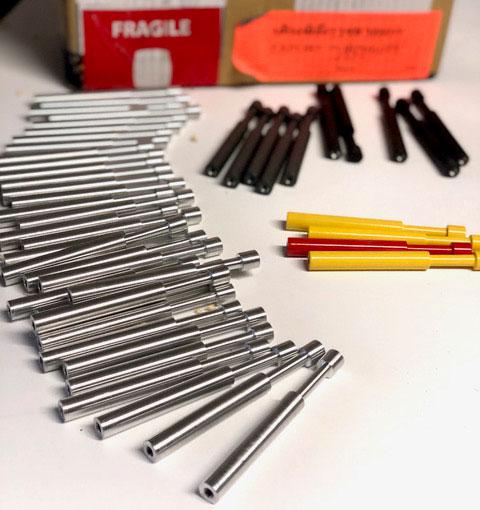
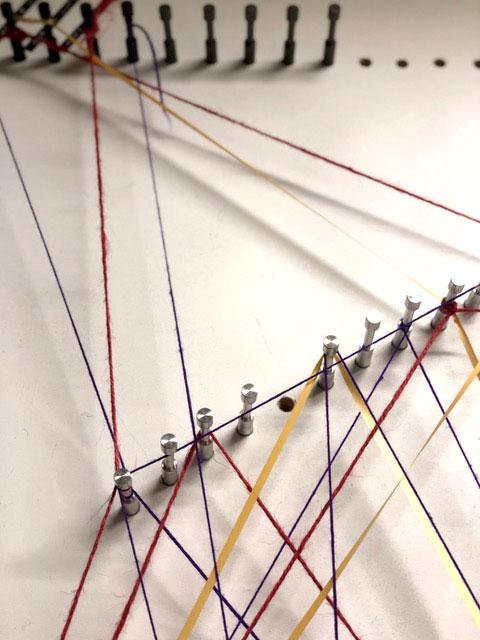
But imagine the complexity of a visualisation that detailed all these career paths spanning both companies and countries! In order to create a physical realisation of the data, we had to pare it down a bit. We created a large graphic that would have mapped the ancestry of those chosen in hundreds of strands of wool with colours picked to represent both country of origin and country of companies. As we never got to build it and all that wool is in a warehouse in Prague, we thought we would share some facts from the submissions and also draw a digital version of what we had planned.
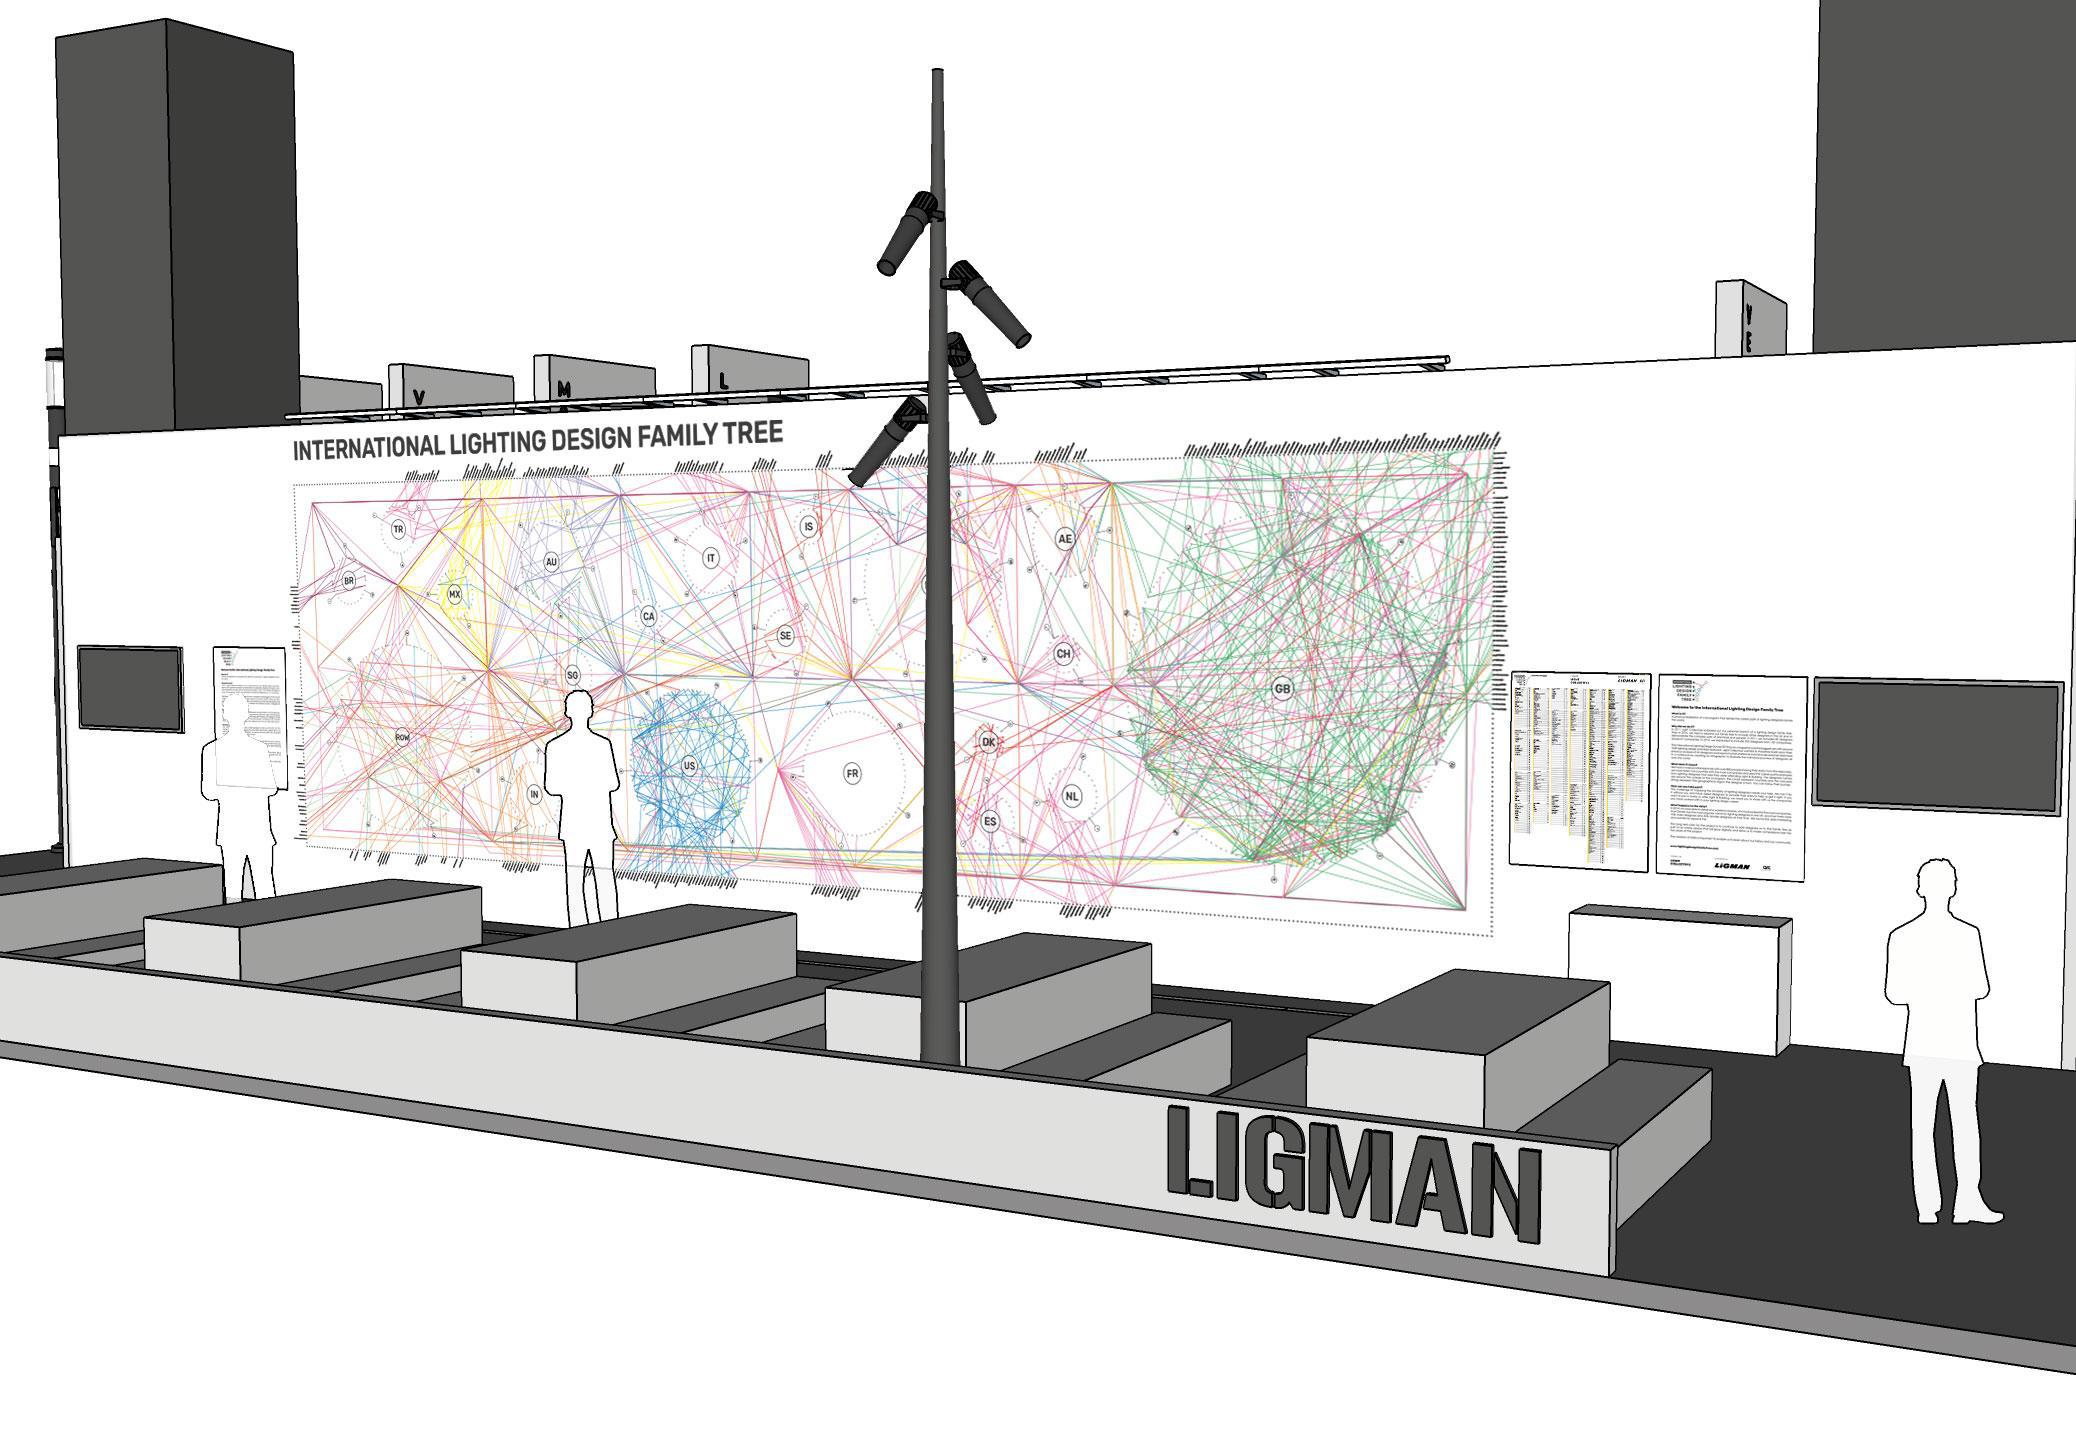
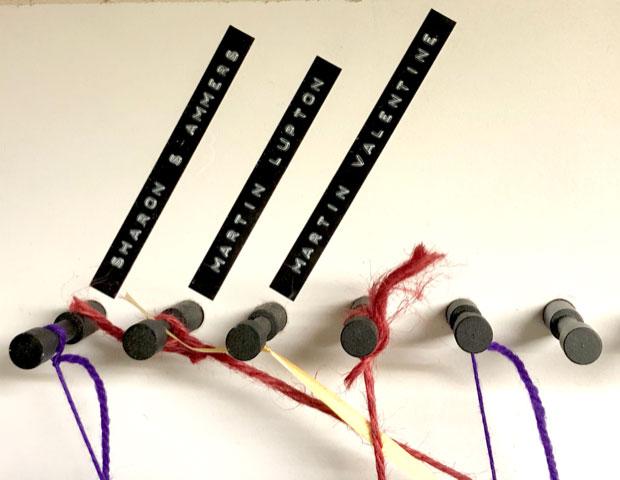


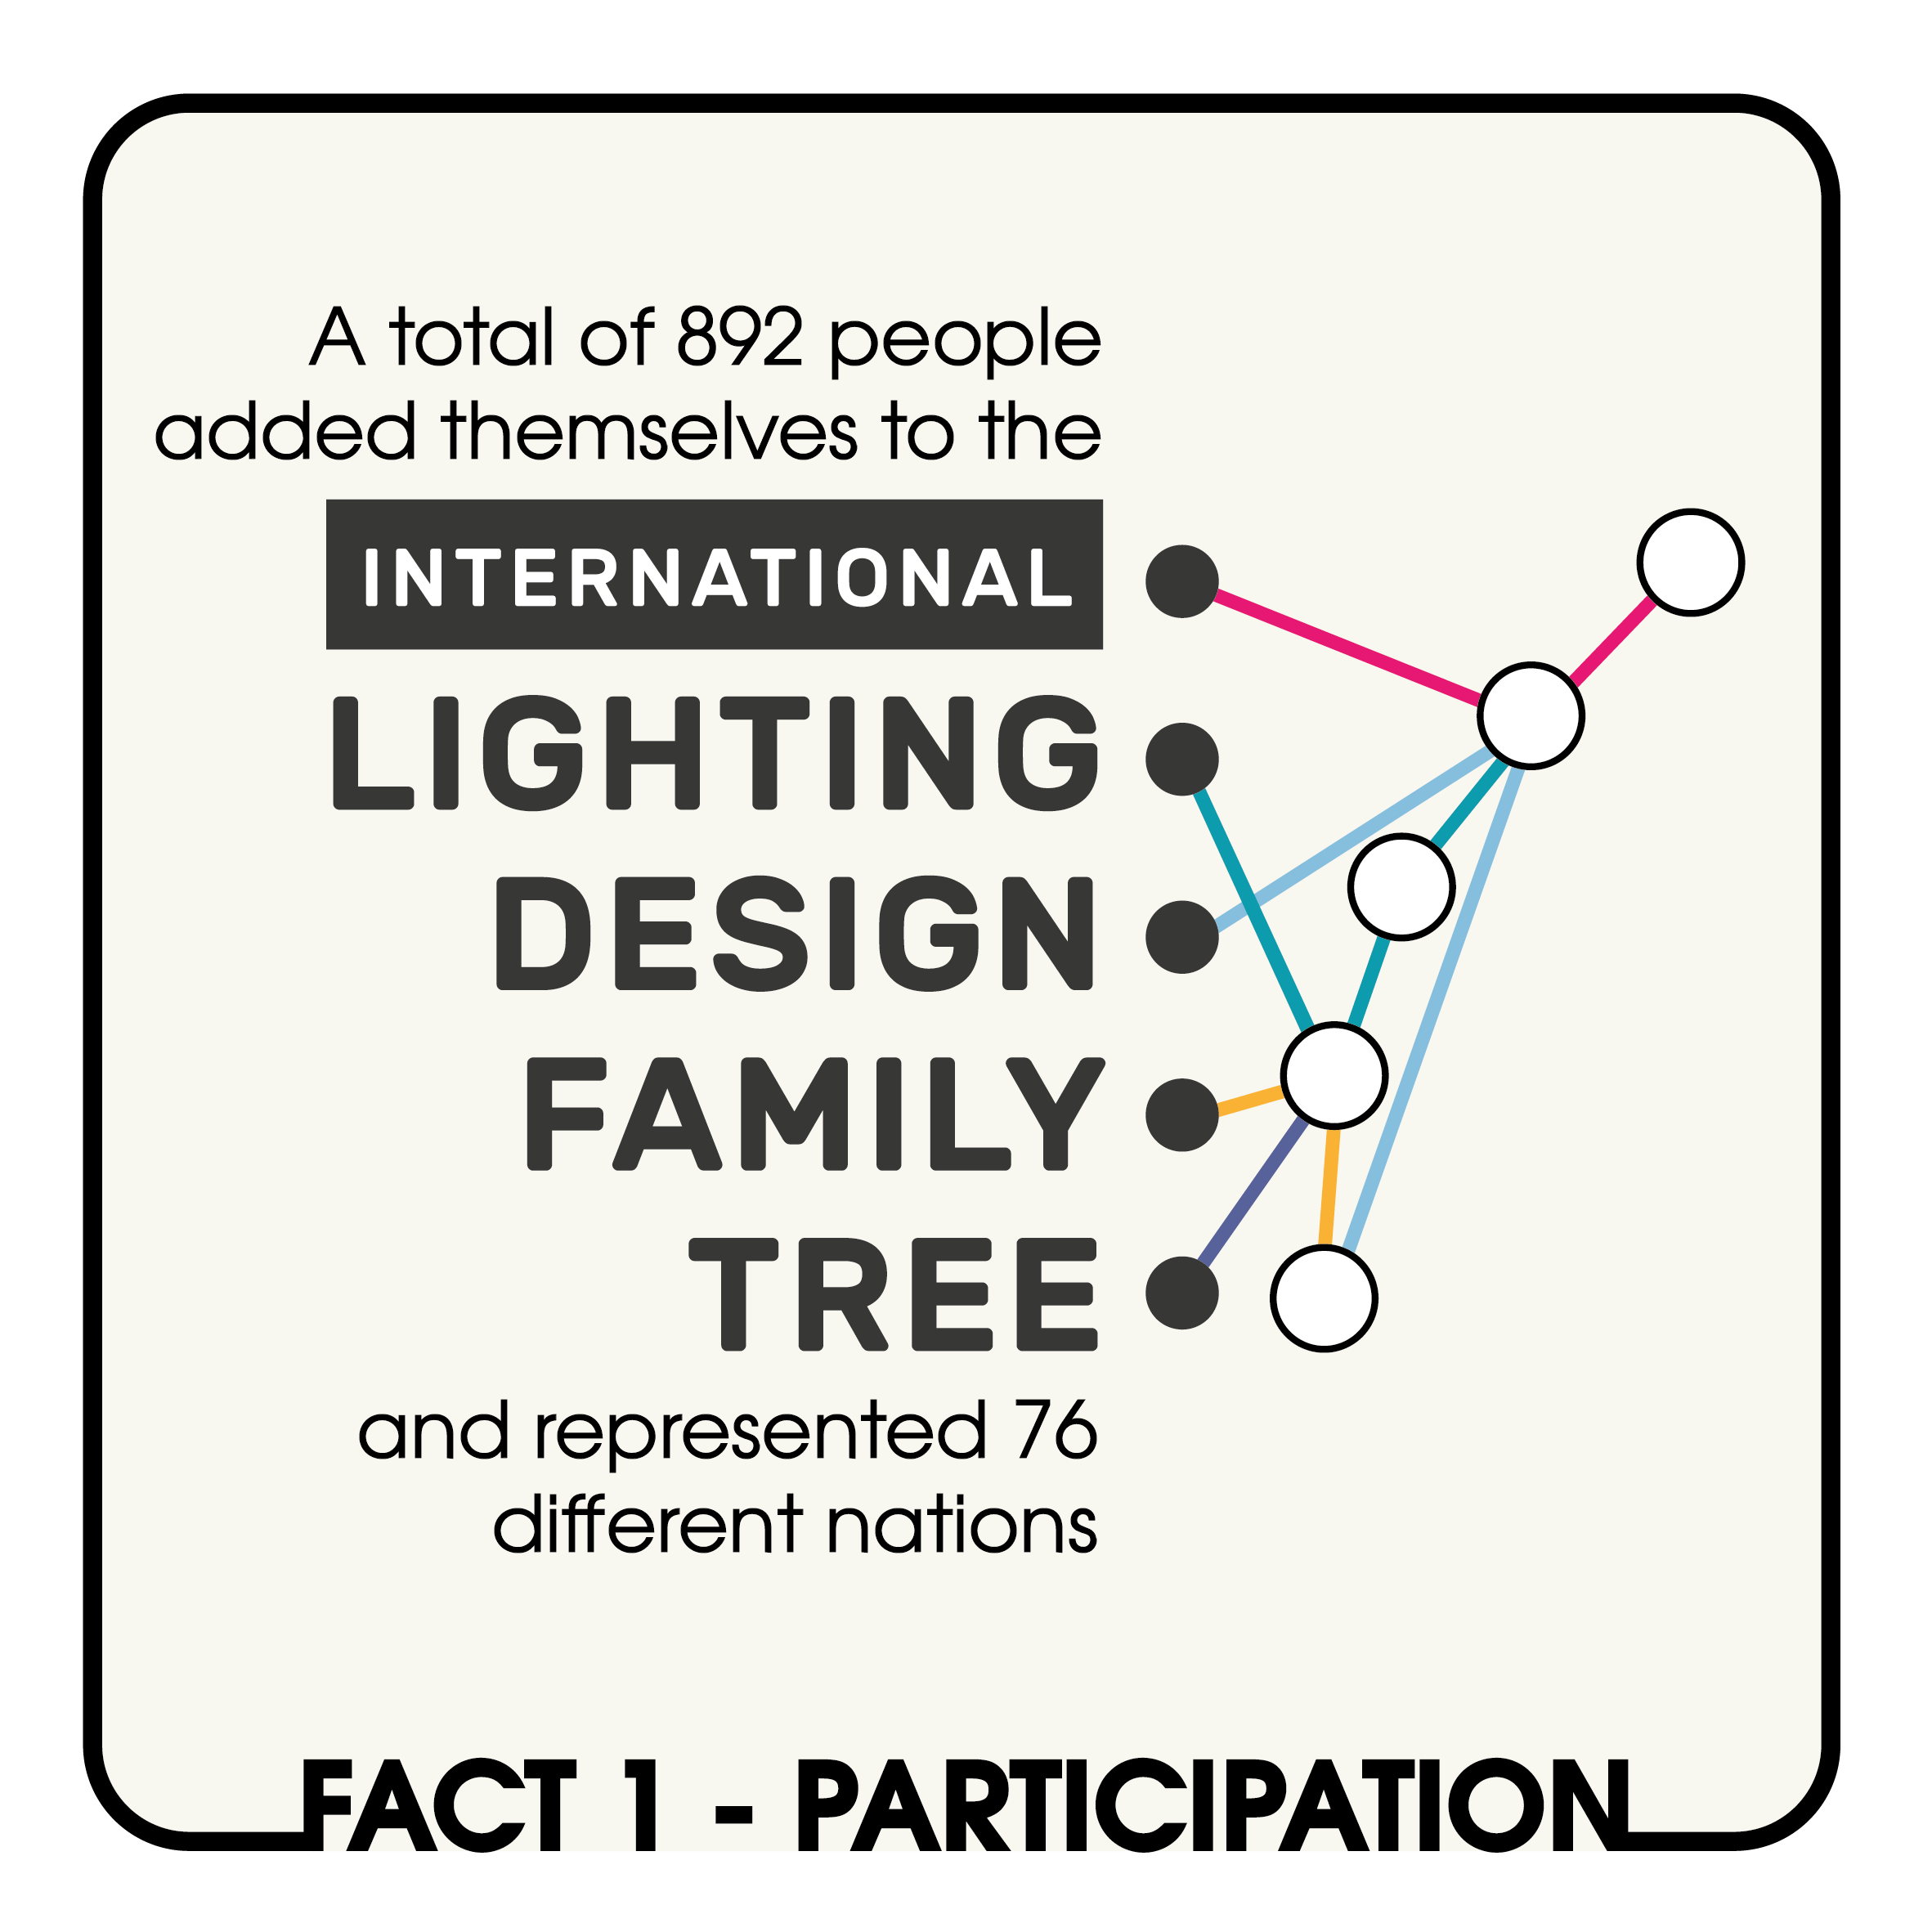
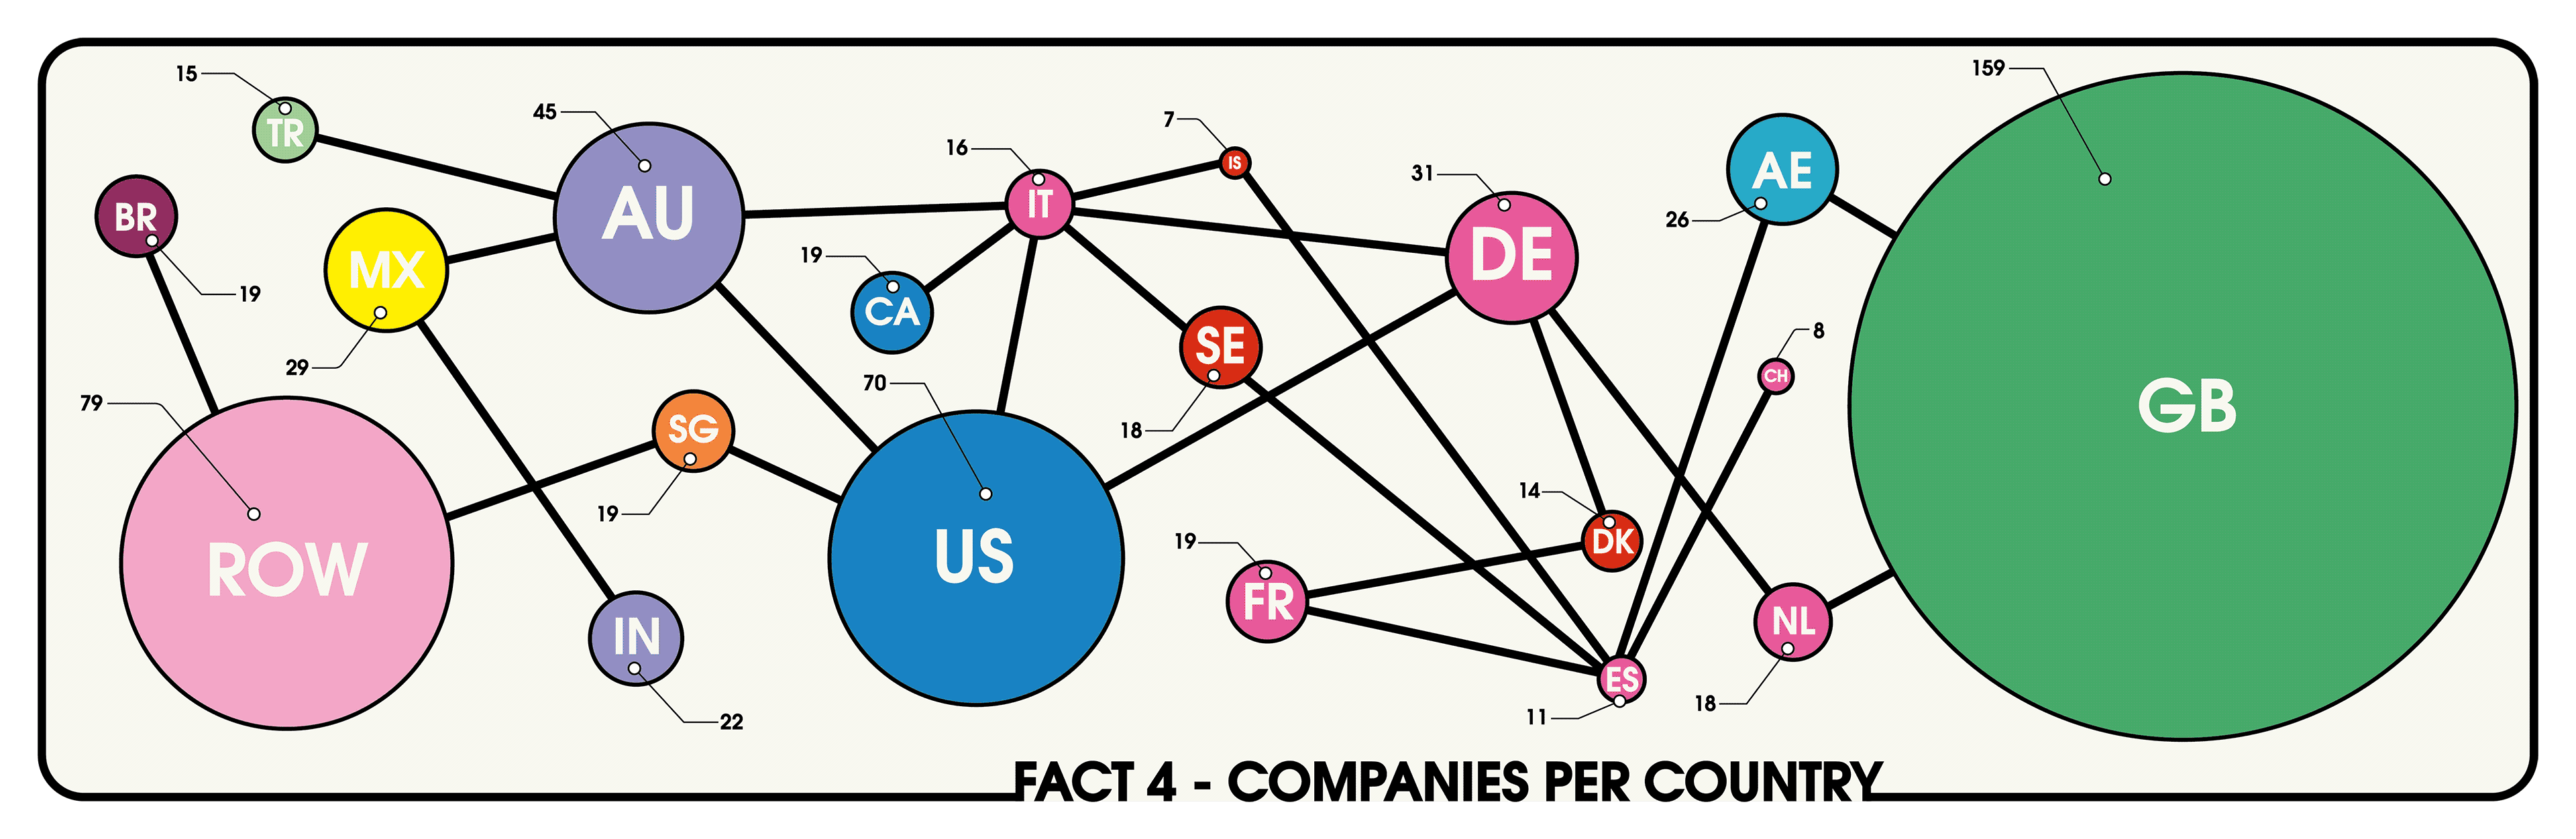
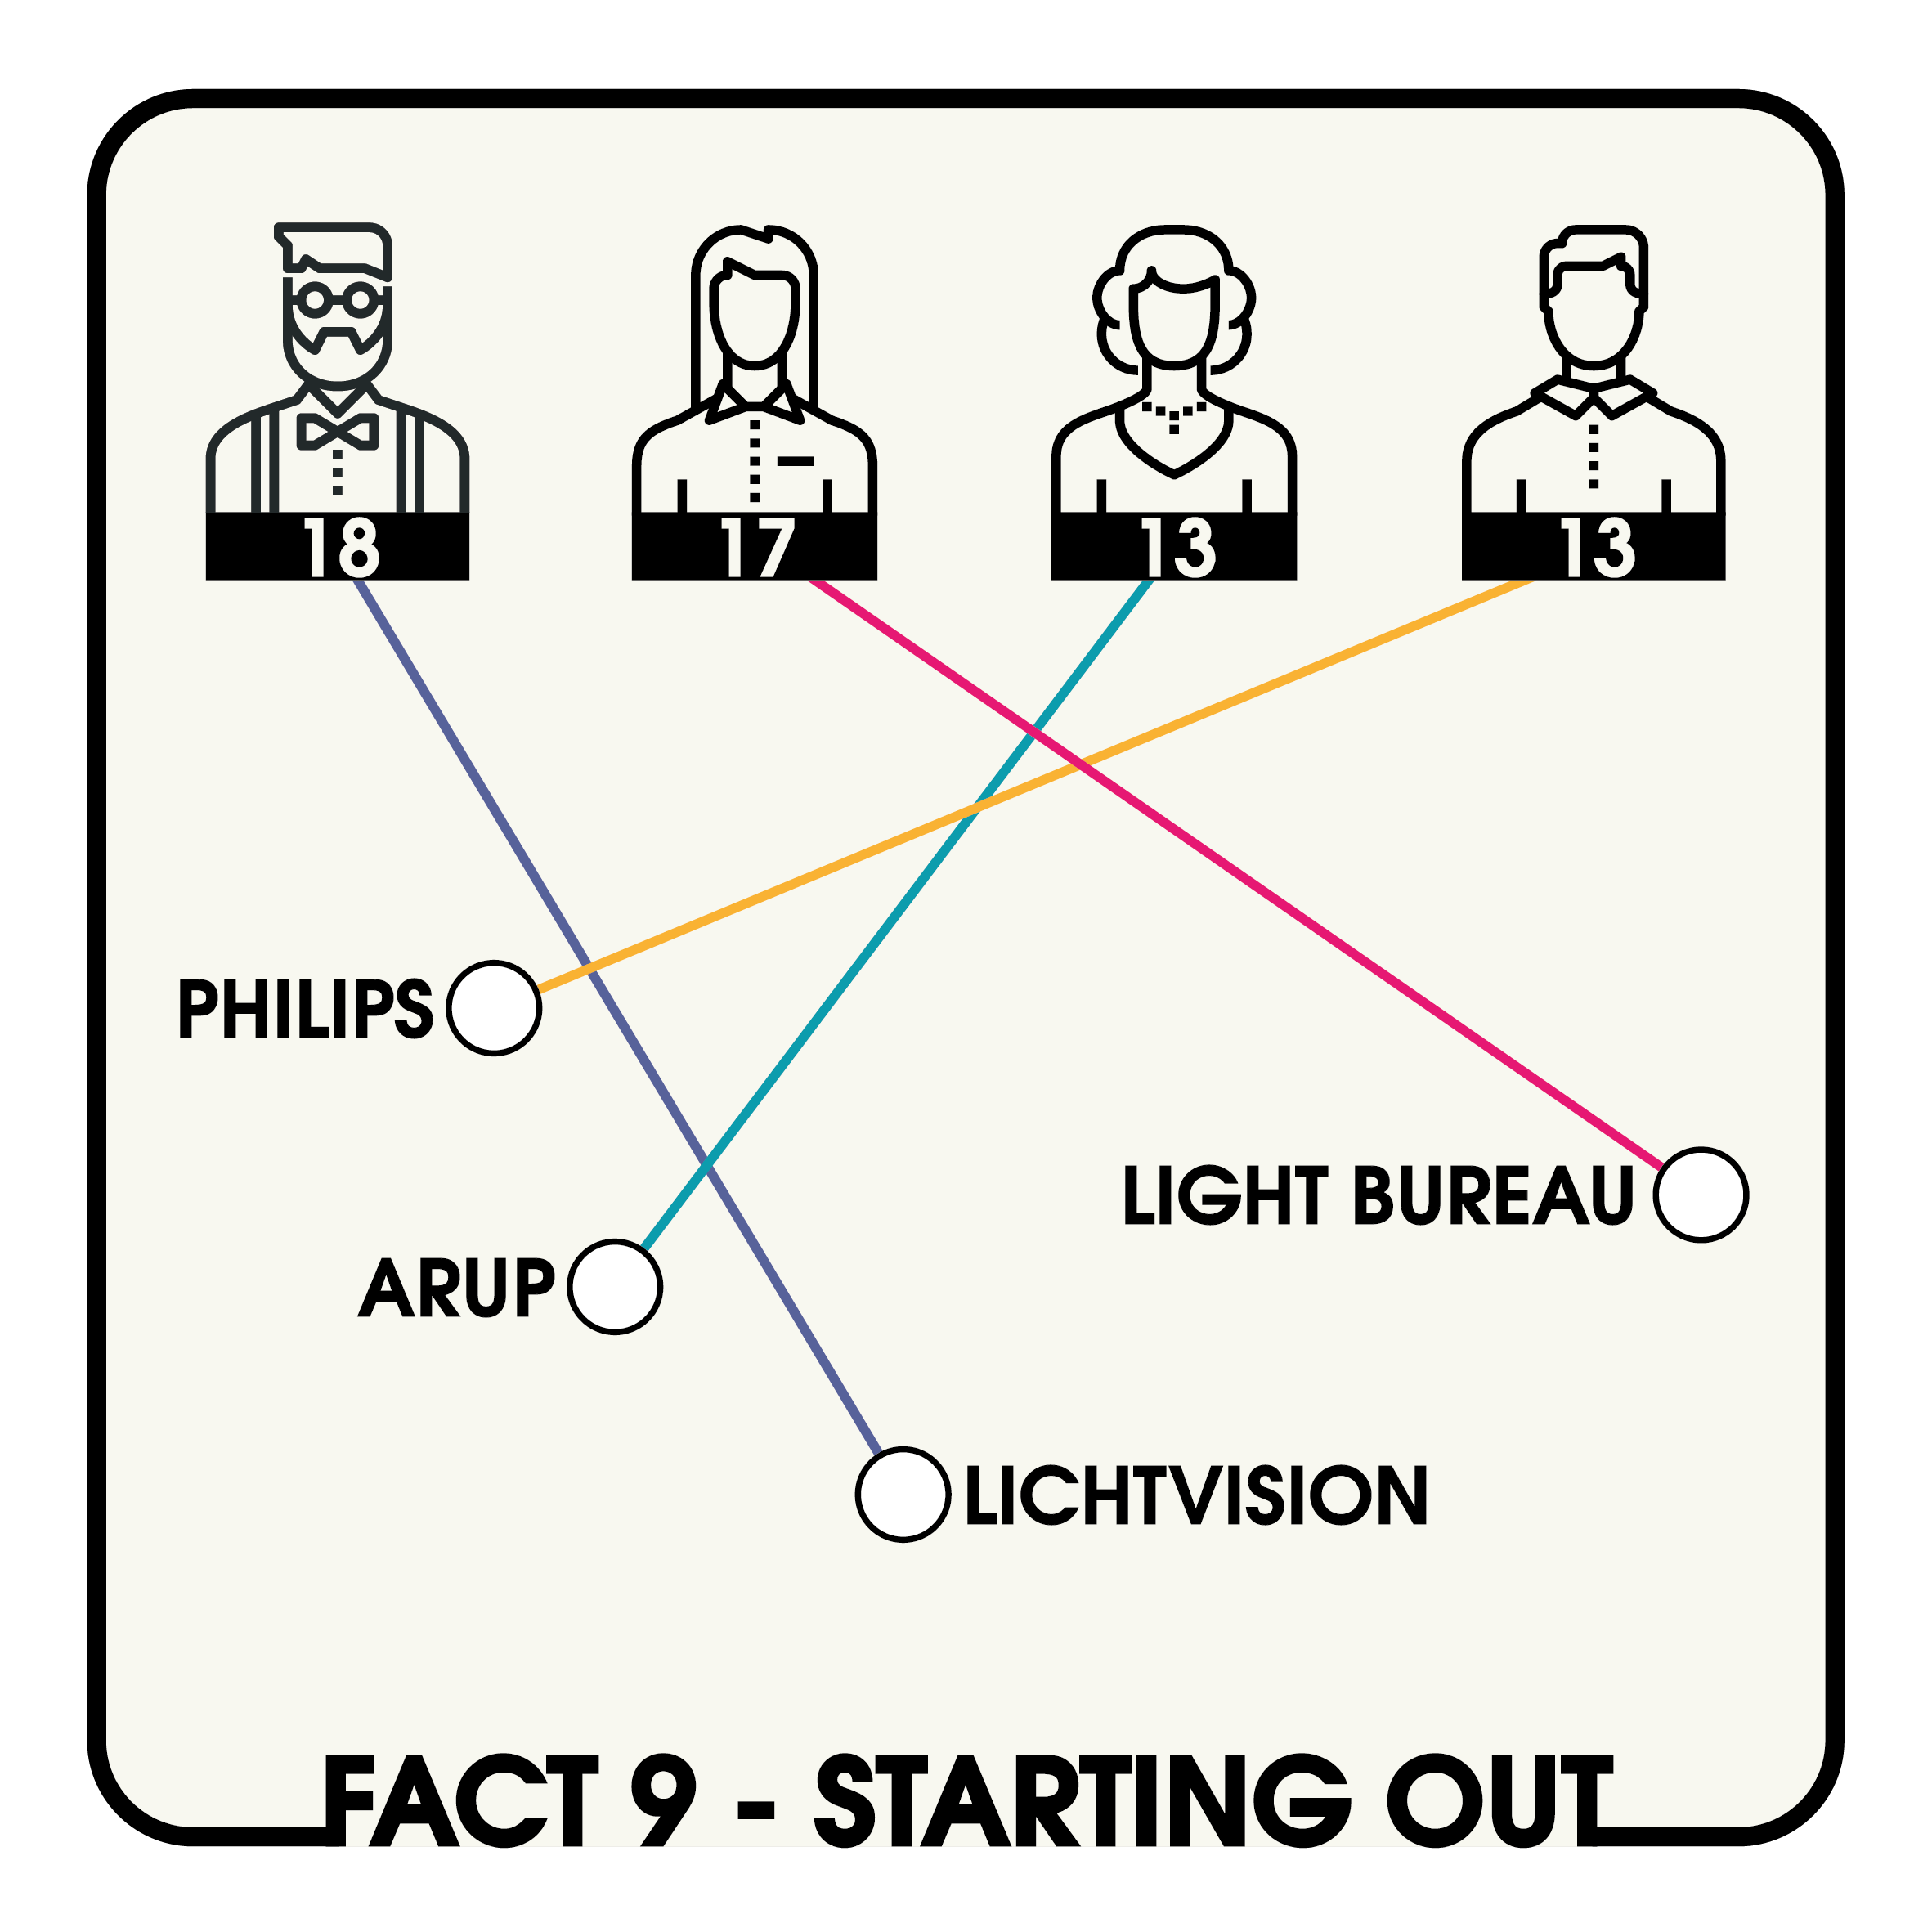
From the responses we received, we have taken the countries with the most companies and used the career paths examples from lighting designers that said they would be attending Light + Building 2020. The designers names are around the outside of the sociogram. The circles represent countries with each dot representing a separate company. The coloured line from each lighting designer represents the geographical region the designer is from and follows their career path from design company to design company and from country to country if applicable.
You can follow their journey below.
How does it work? A coloured string from each lighting designer peg follows their career path from design company to design company. The colour of the string represents the global region they are from and the design companies are seperated into countries in large circles with each peg representing a seperate company.
Download Visualisation as PDF